

In this page, some relevant sr-niel treatment and framework results are shown in different sections:
- Screened relativistic treatment
- SR-NIEL results from solar cells radiation damage investigations with electrons, protons and neutrons
- Electronic stopping power and restricted energy loss in SR-framework
Screened relativist treatment
From Leroy and Rancoita (2016):
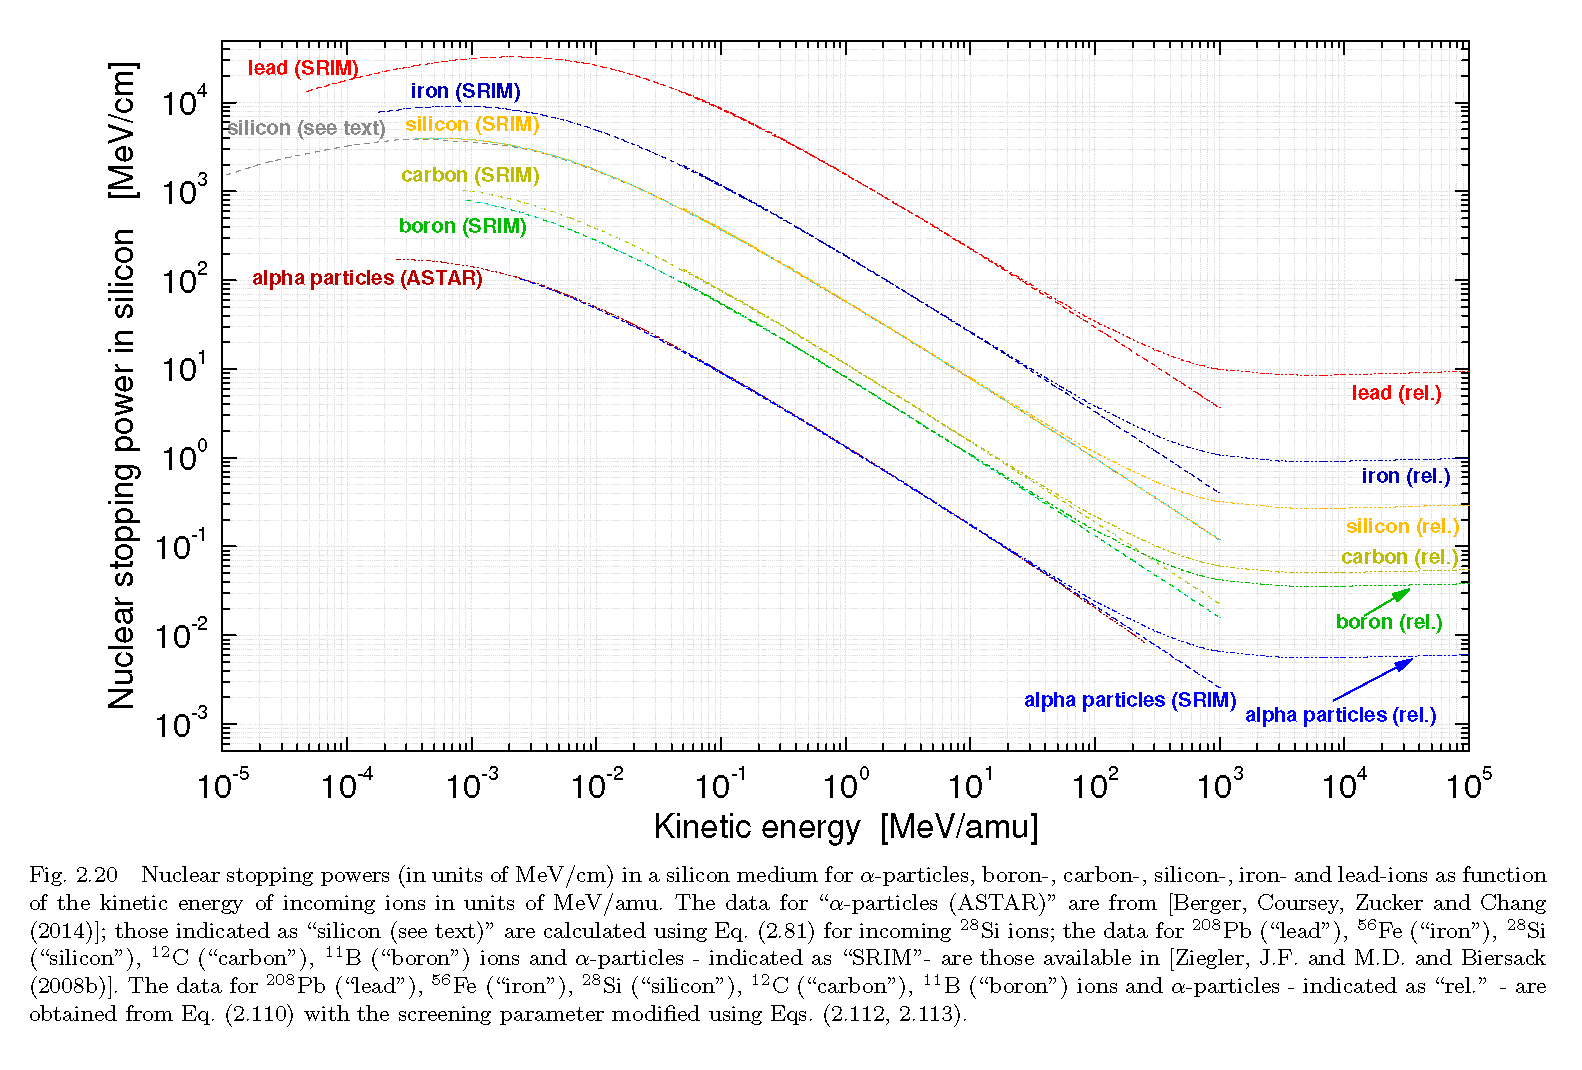
Nuclear stopping power (in units of MeV/cm) in Silicon medium for different incoming ions as function of the kinetic energy compared to ASTAR and SRIM results:
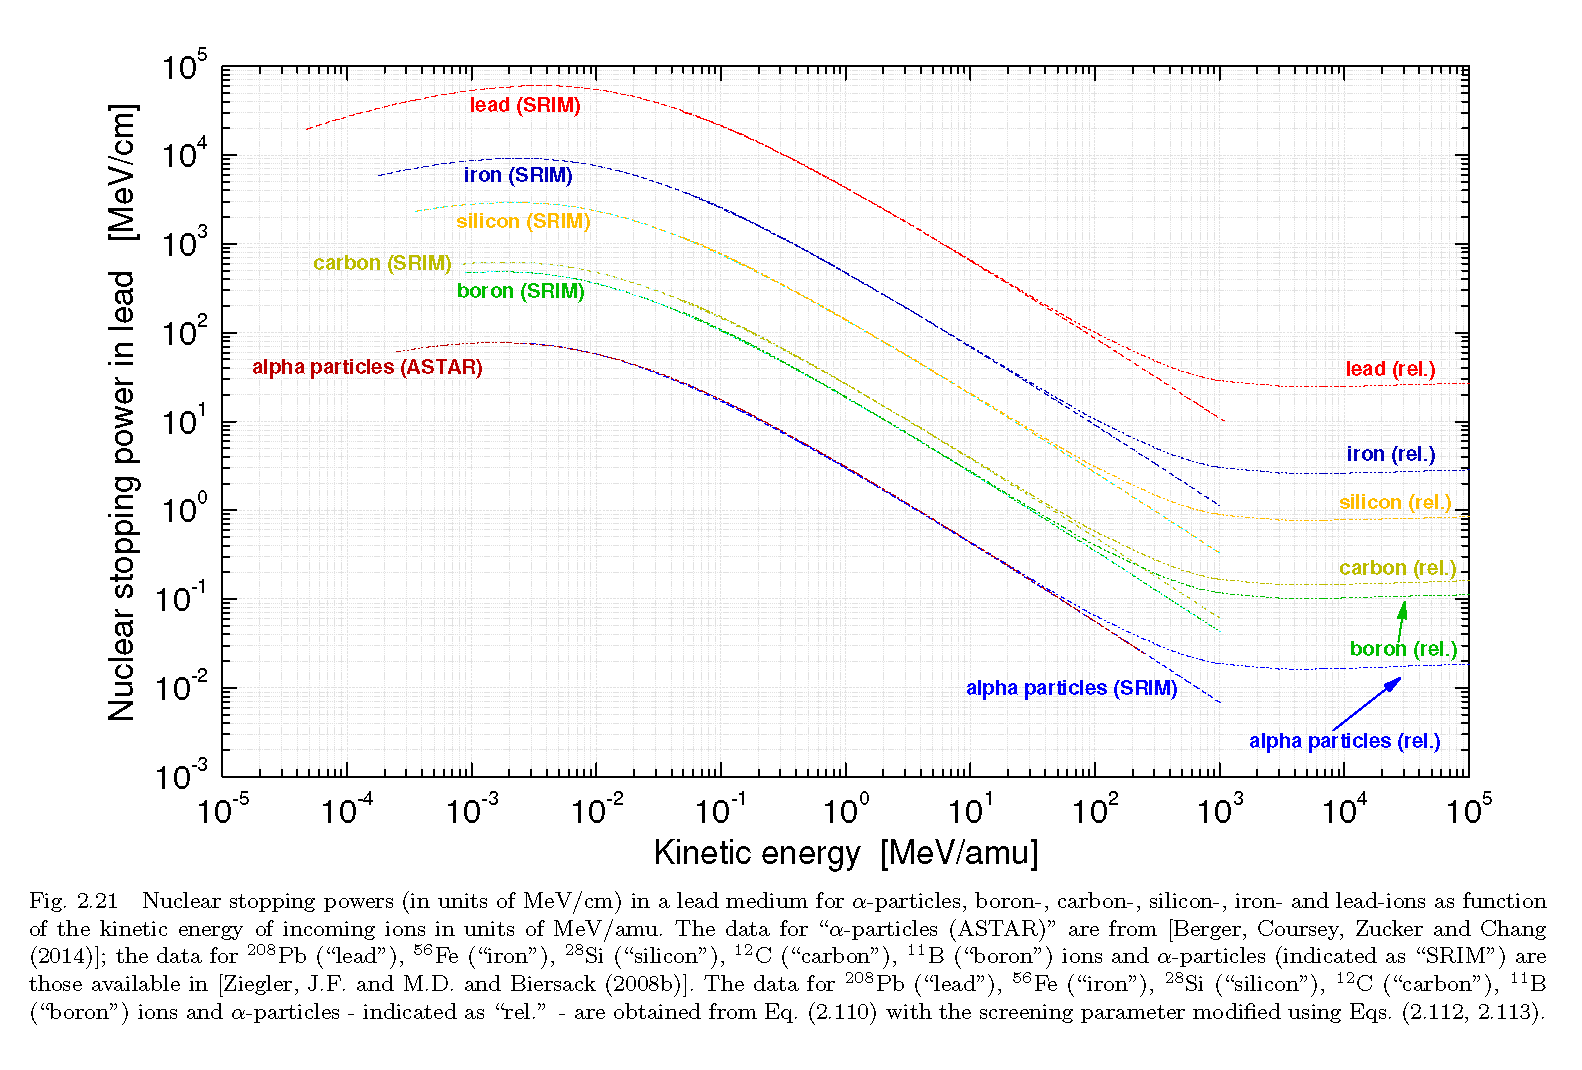
Nuclear stopping power (in units of MeV/cm) is Lead medium for different incoming ions as function of the kinetic energy compared to ASTAR and SRIM results:
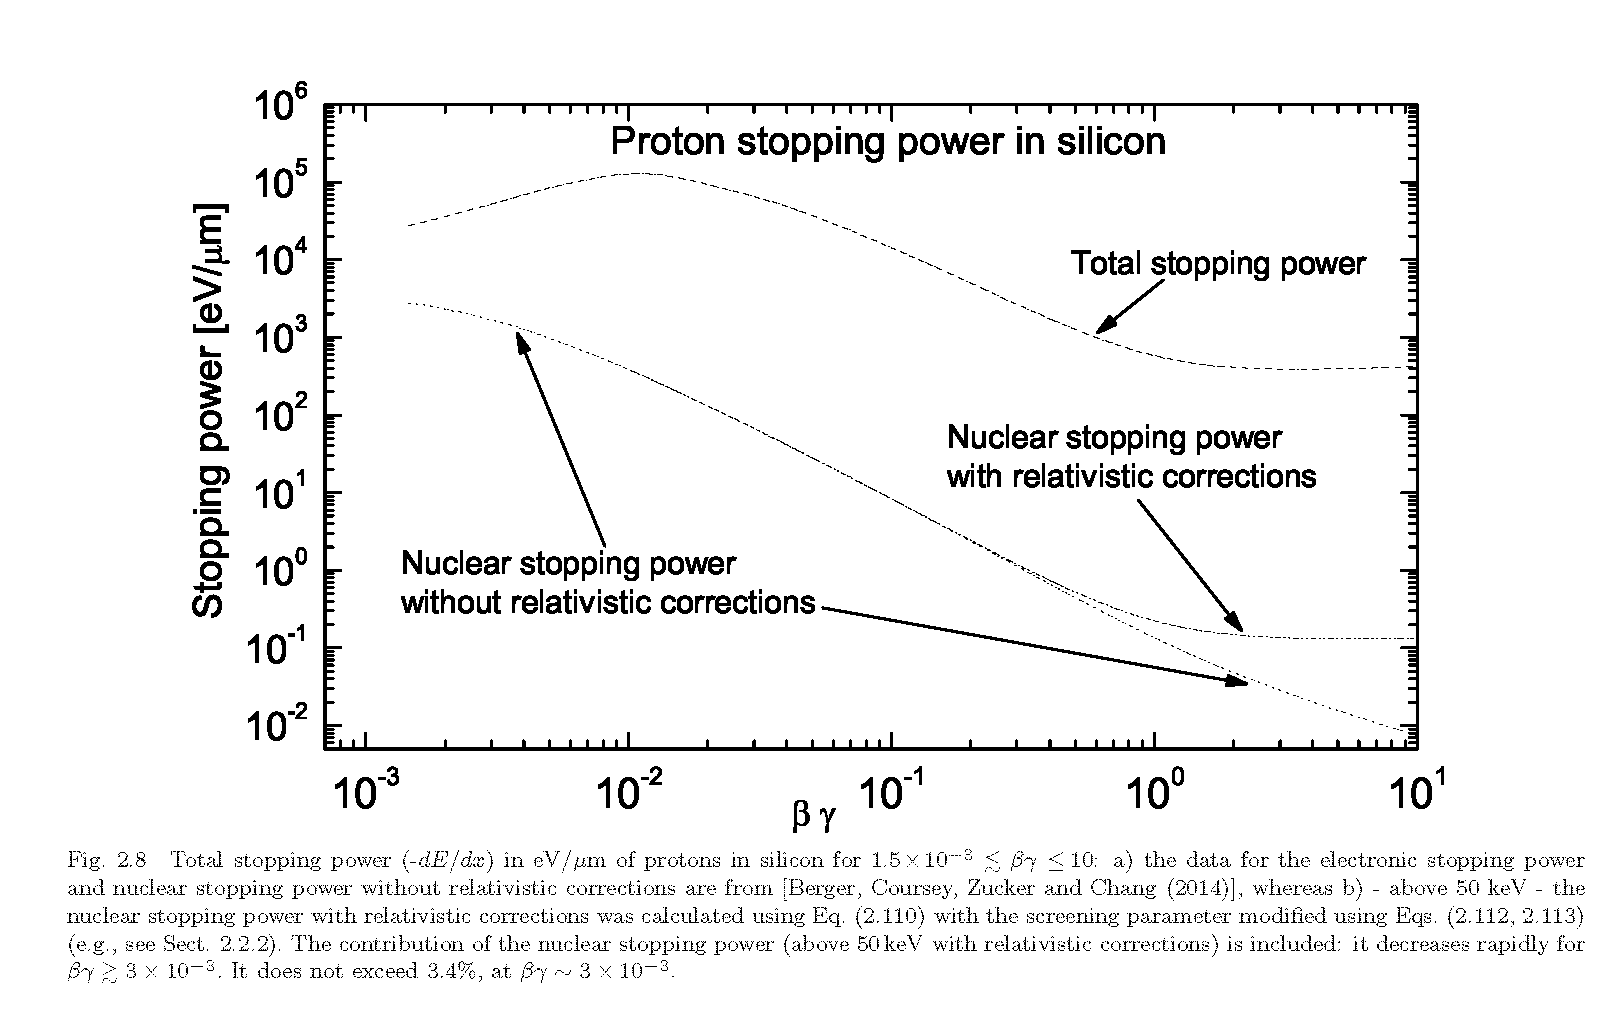
Total stopping power of protons in Silicon where the effect of relativistic correction is underlined:
From C.Baur et al. (2014):
NIEL for electrons in Silicon as a function of the kinetic energy compared to values in literature:
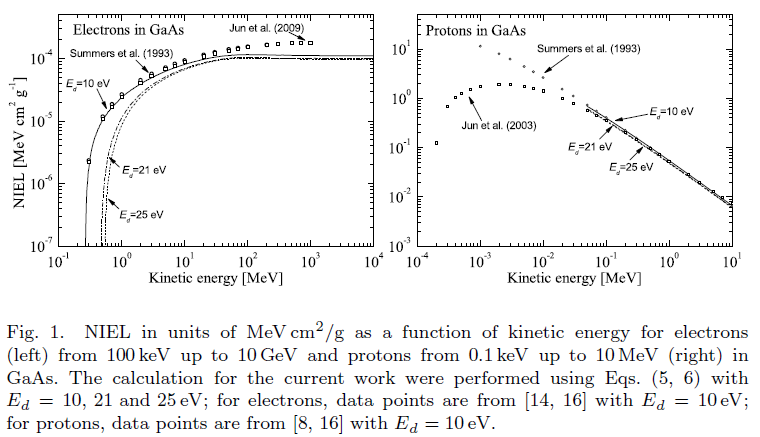
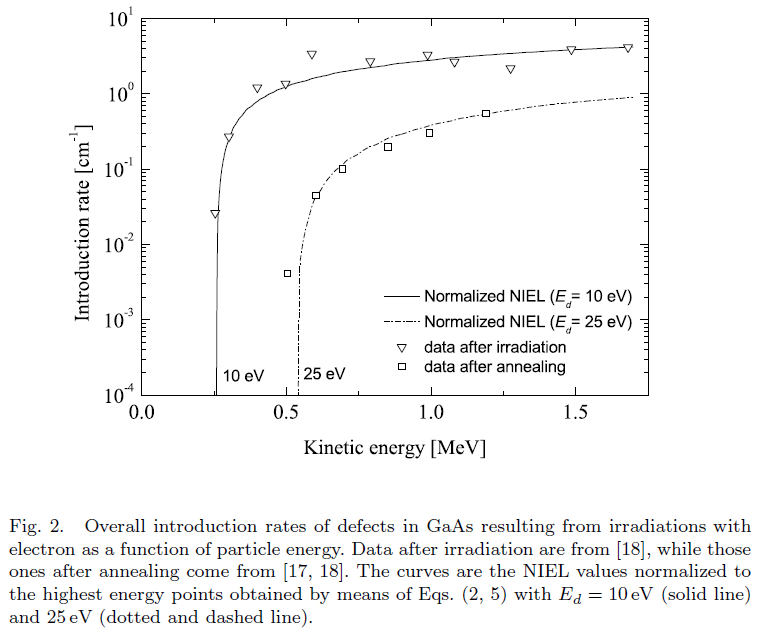
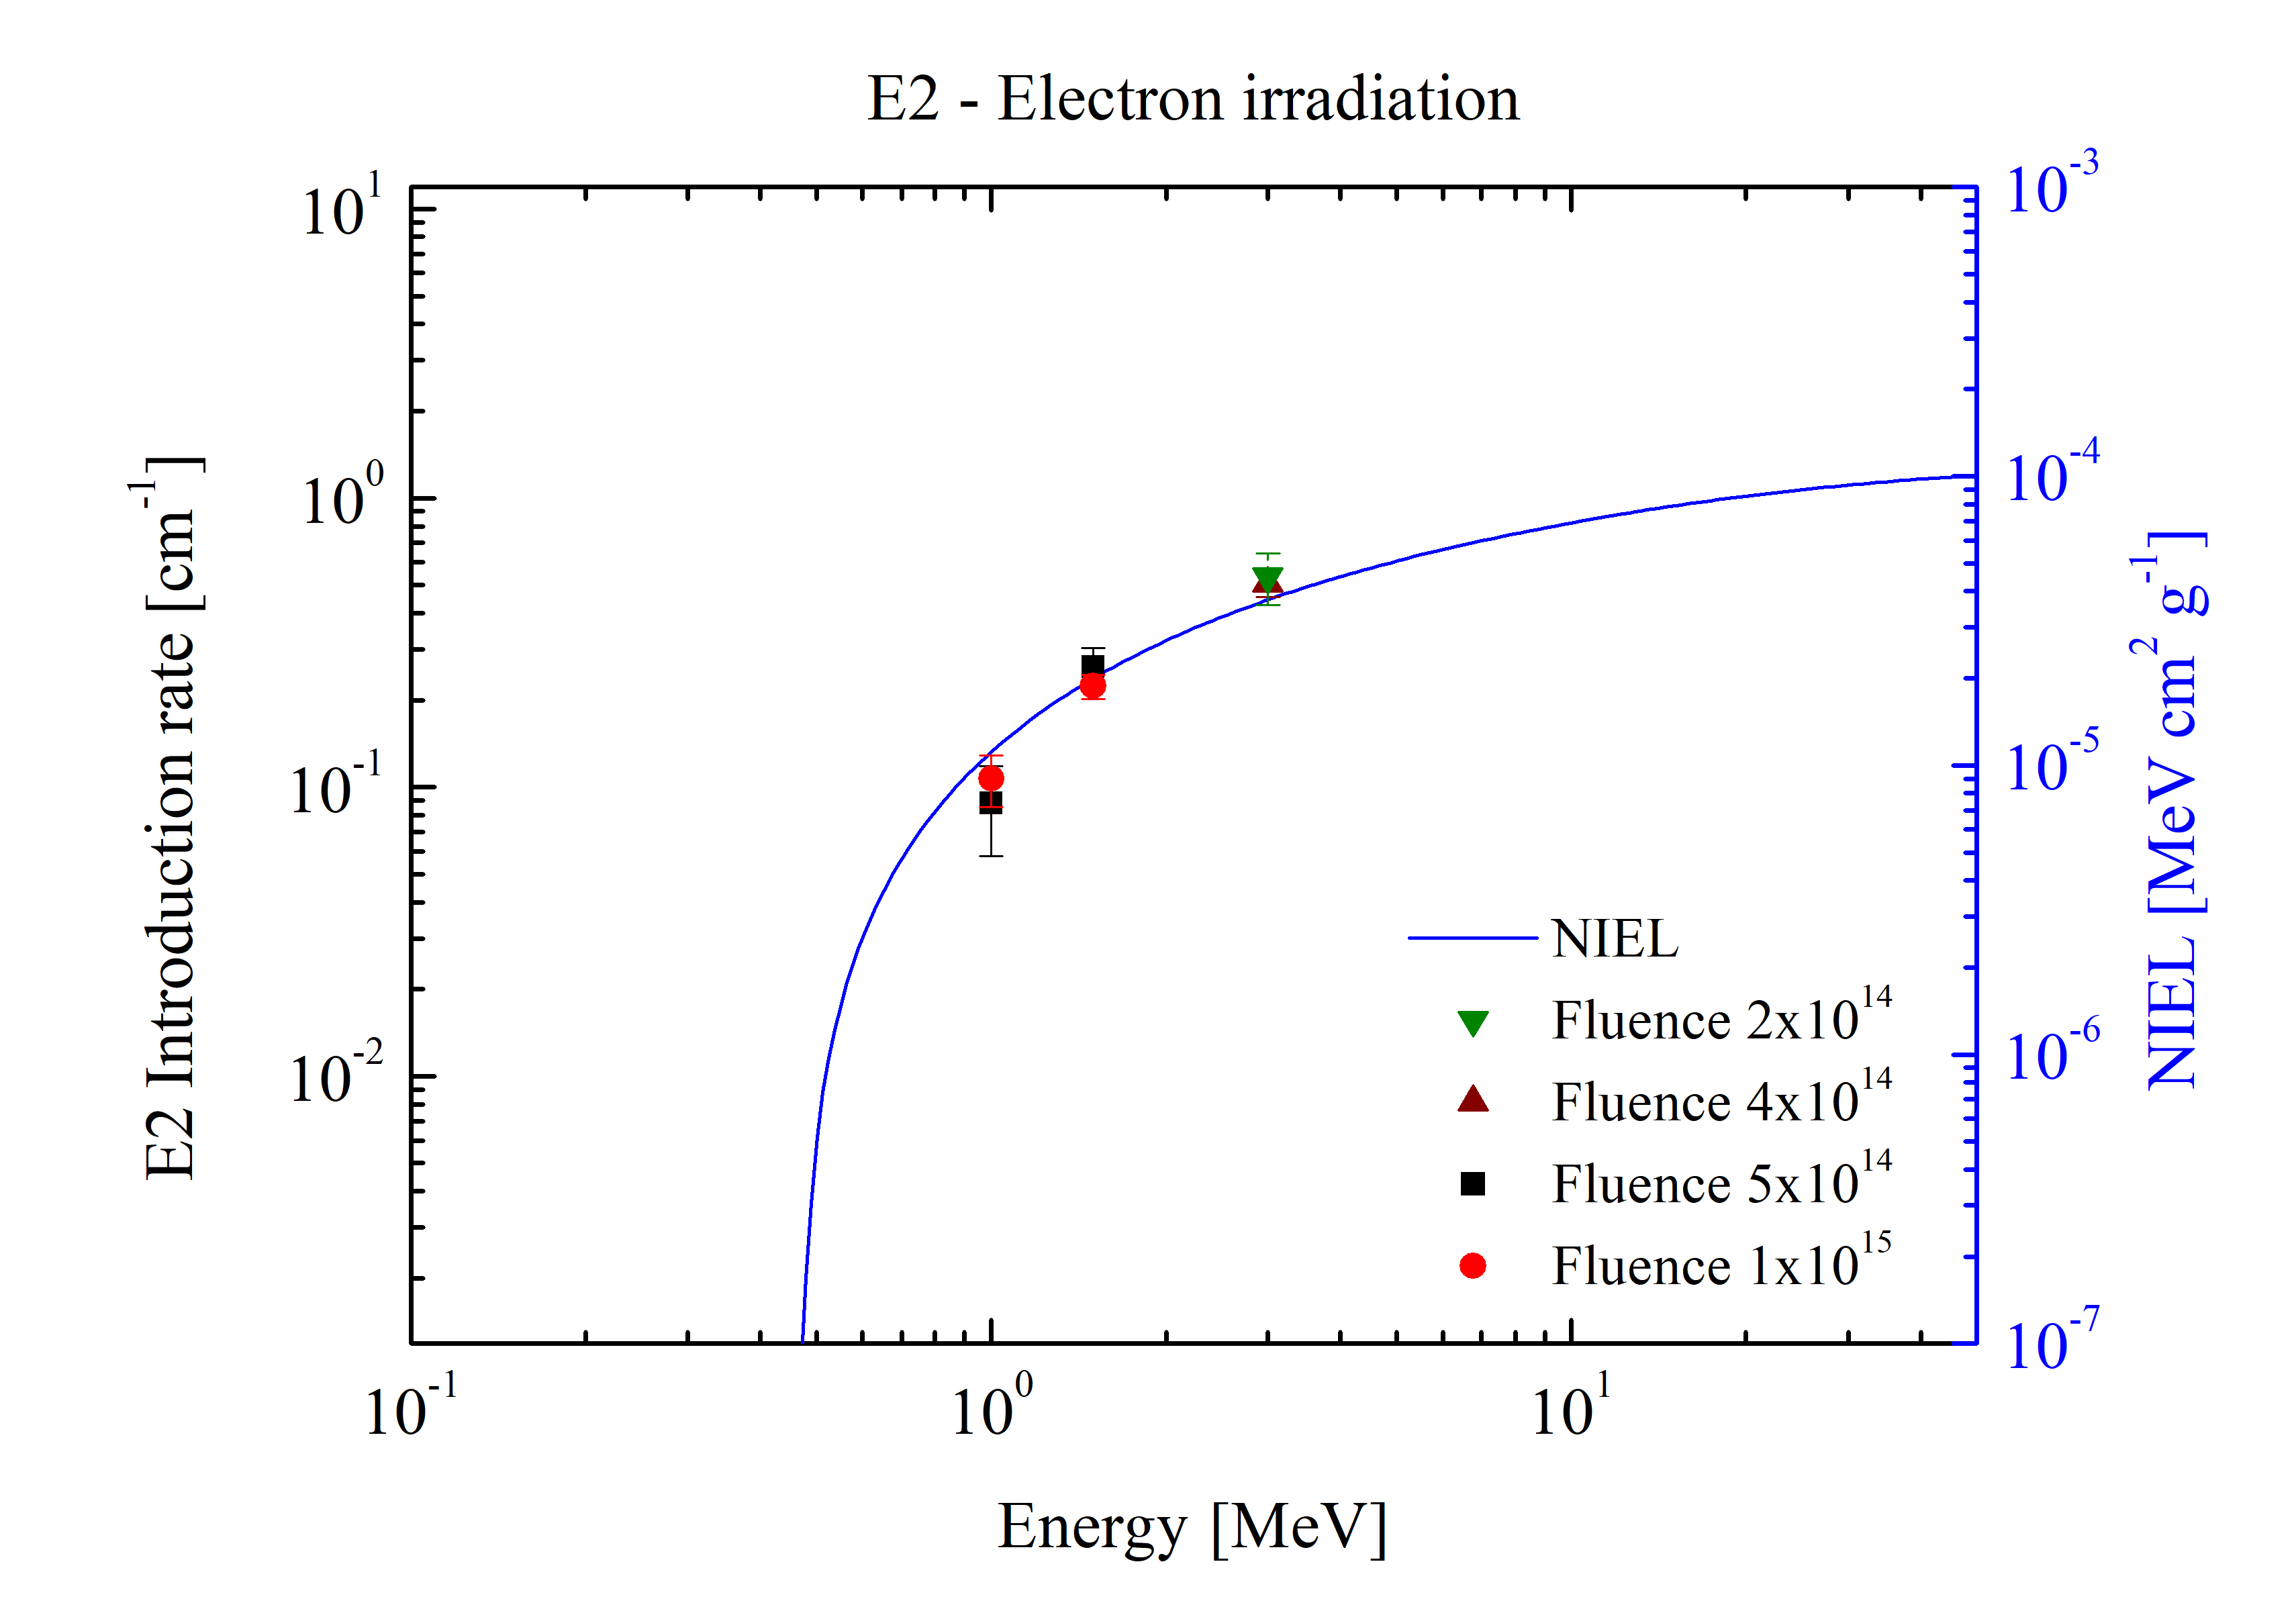
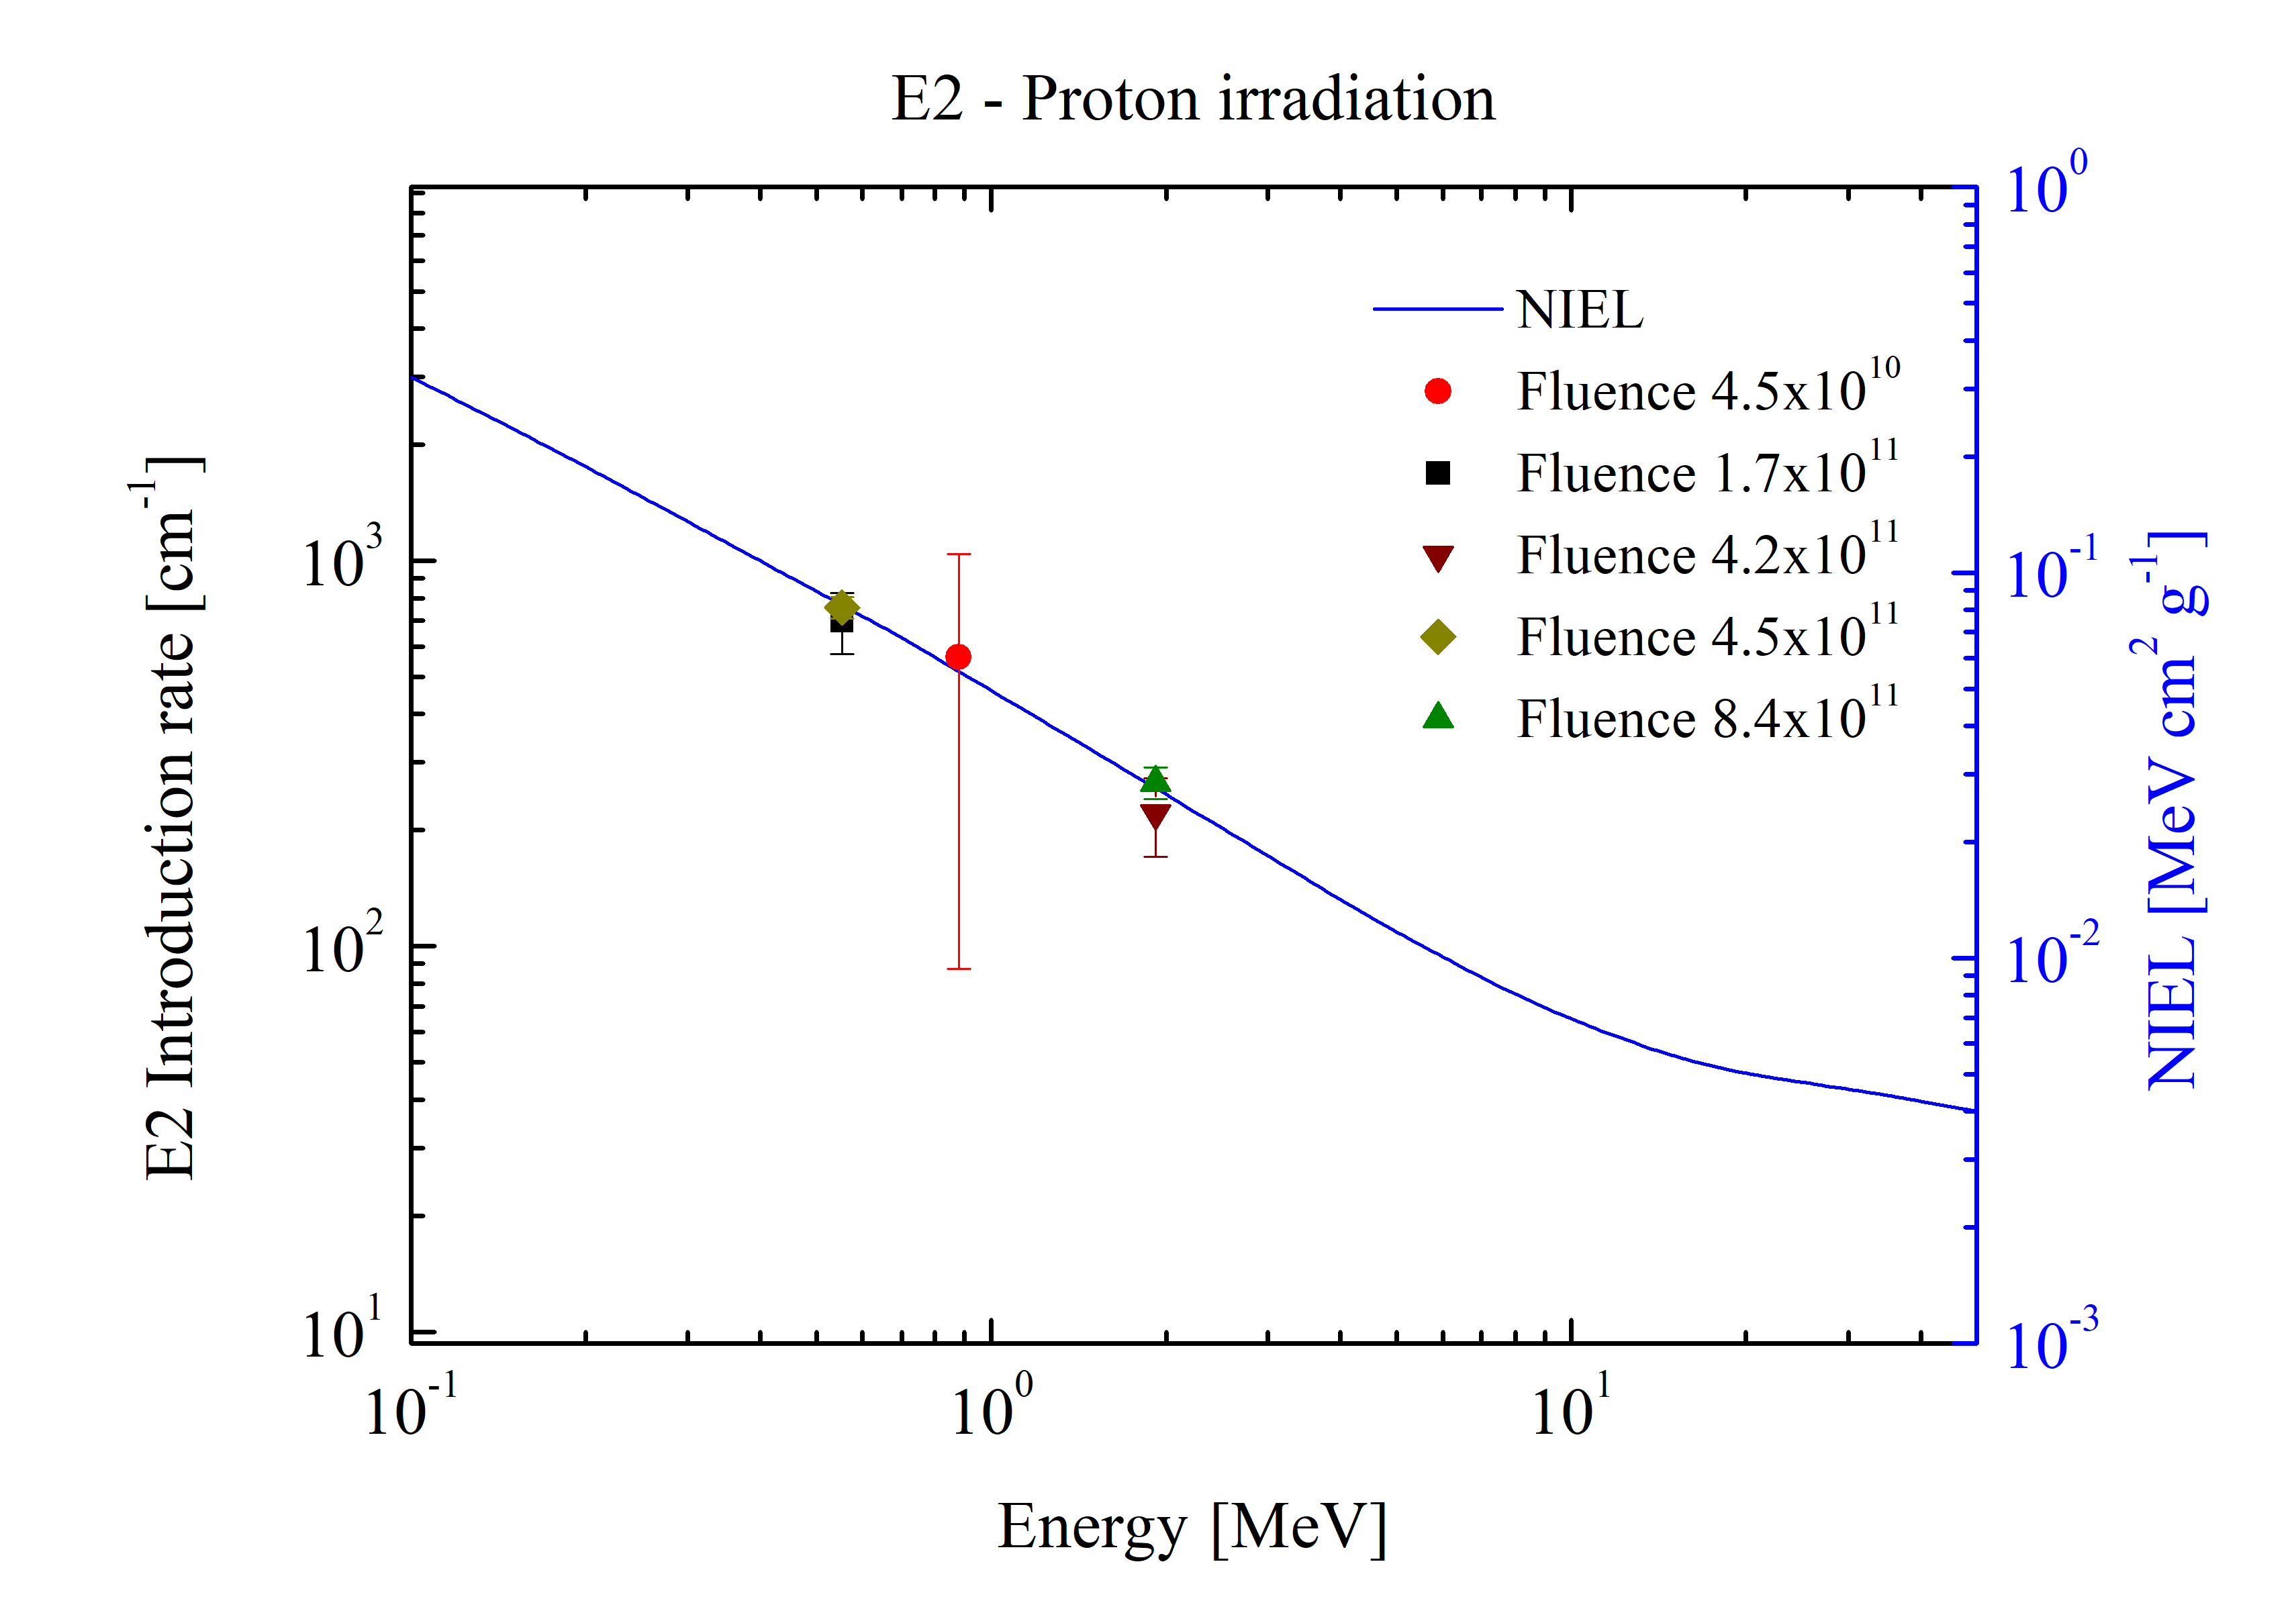
Overall introduction rates of defects in GaAs resulting from irradiations with electrons as a function of the particle energy:
From M.J. Boschini et al. (2012):
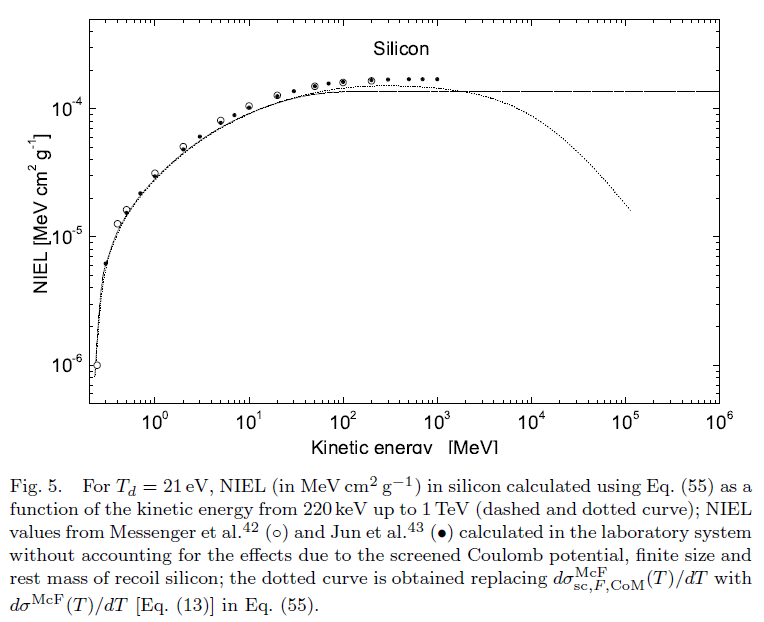
NIEL for electrons in Silicon as a function of the kinetic energy compared to values in literature:
From M.J. Boschini et al. (2011):
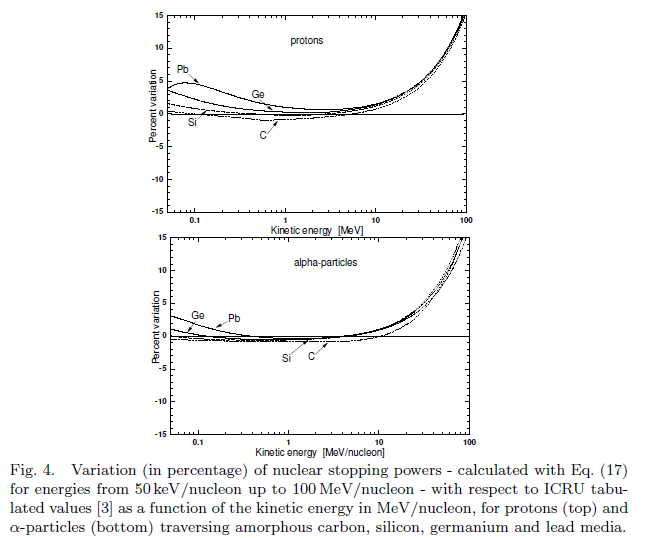
Comparison of the nuclear stopping power obtained with Wentzel cross section with respect ICRU tabulated values for protons and alpha particles in different target material:
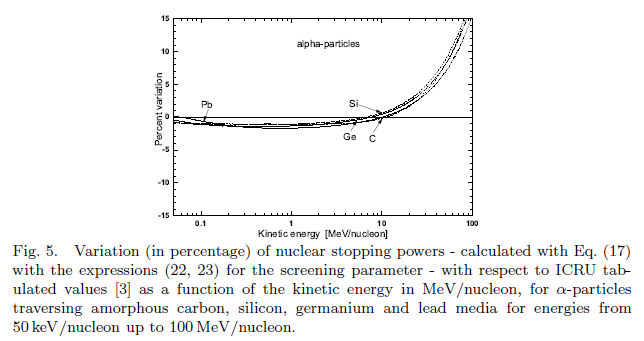
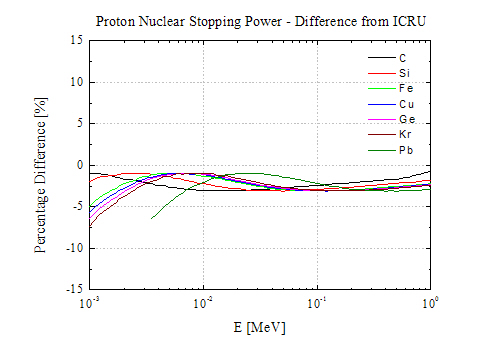
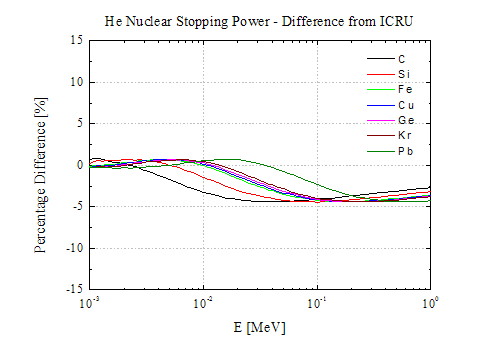
Comparison of the nuclear stopping power obtained with SR-NIEL code with respect ICRU tabulated values for protons and alpha particles in different target material:
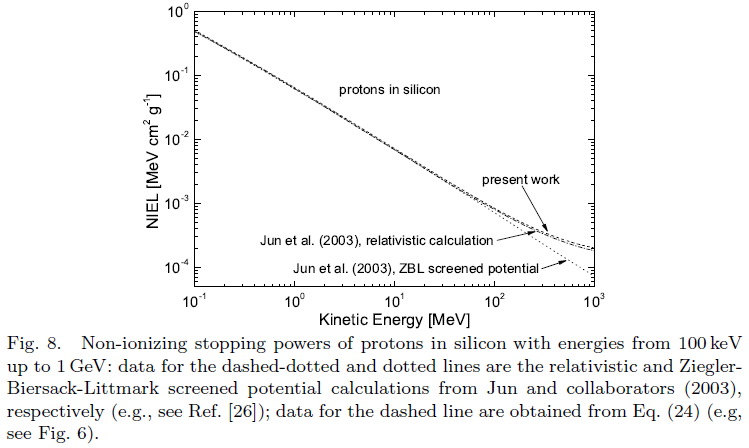
Comparison of the NIEL obtained with SR-NIEL code with respect values in literature:
Comparison with ICRU 1993 (see also PSTAR and ASTAR) for protons and alpha particles in different materials (SR-NIEL Code version 1.5 November 2014):
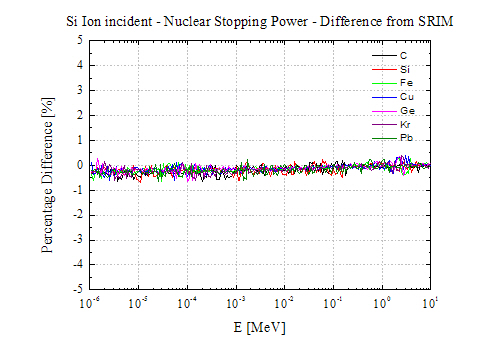
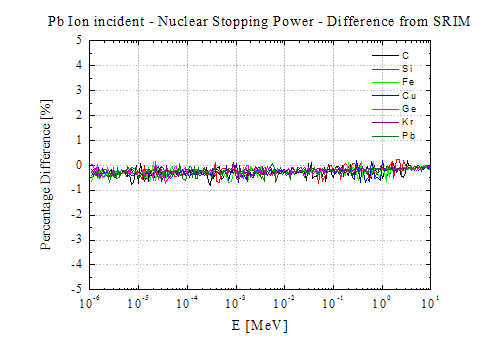
Comparison with table obtained from SRIM (v. 2013.0) for Si and Pb ions incident on different target materials (SR-NIEL Code version 1.5 November 2014):
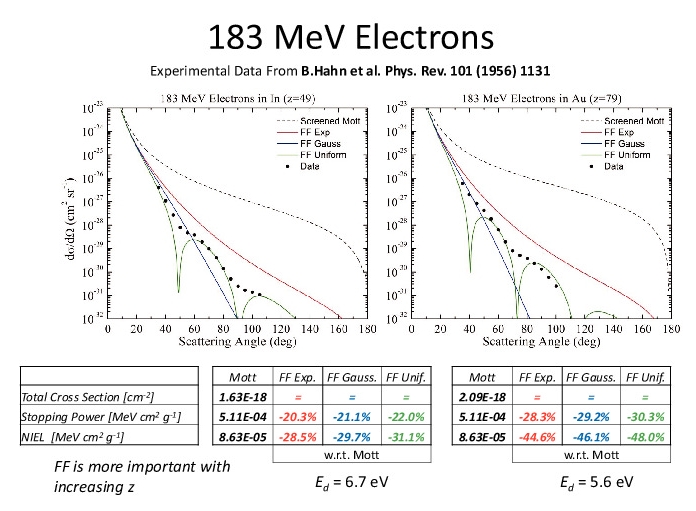
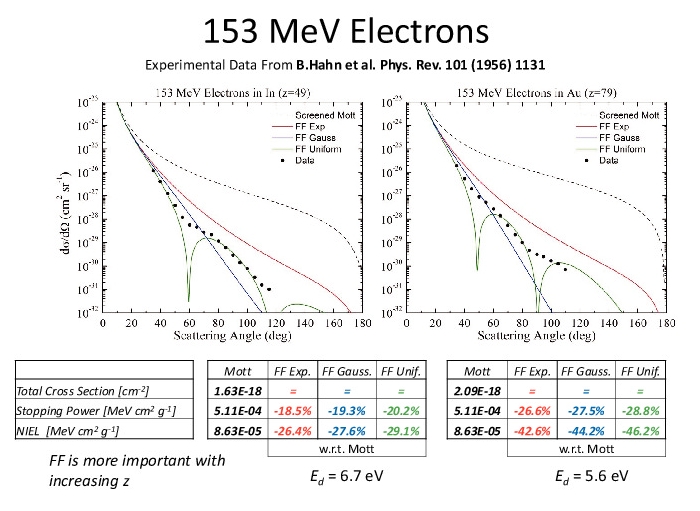
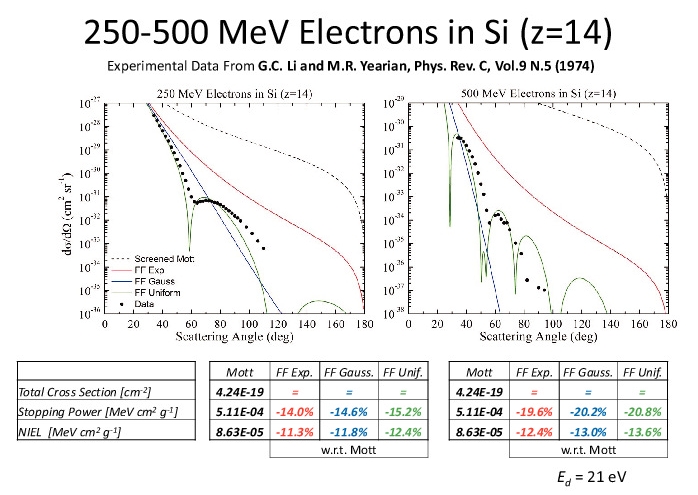
Comparison of the SR-treatment for electrons with experimental data on a few nuclei:
SR-NIEL results from solar cells radiation damage investigation with electrons, protons and neutrons
SR-NIEL results from solar cells radiation damage investigation with electrons, protons and neutrons
From R.Campesato et al. (2019).
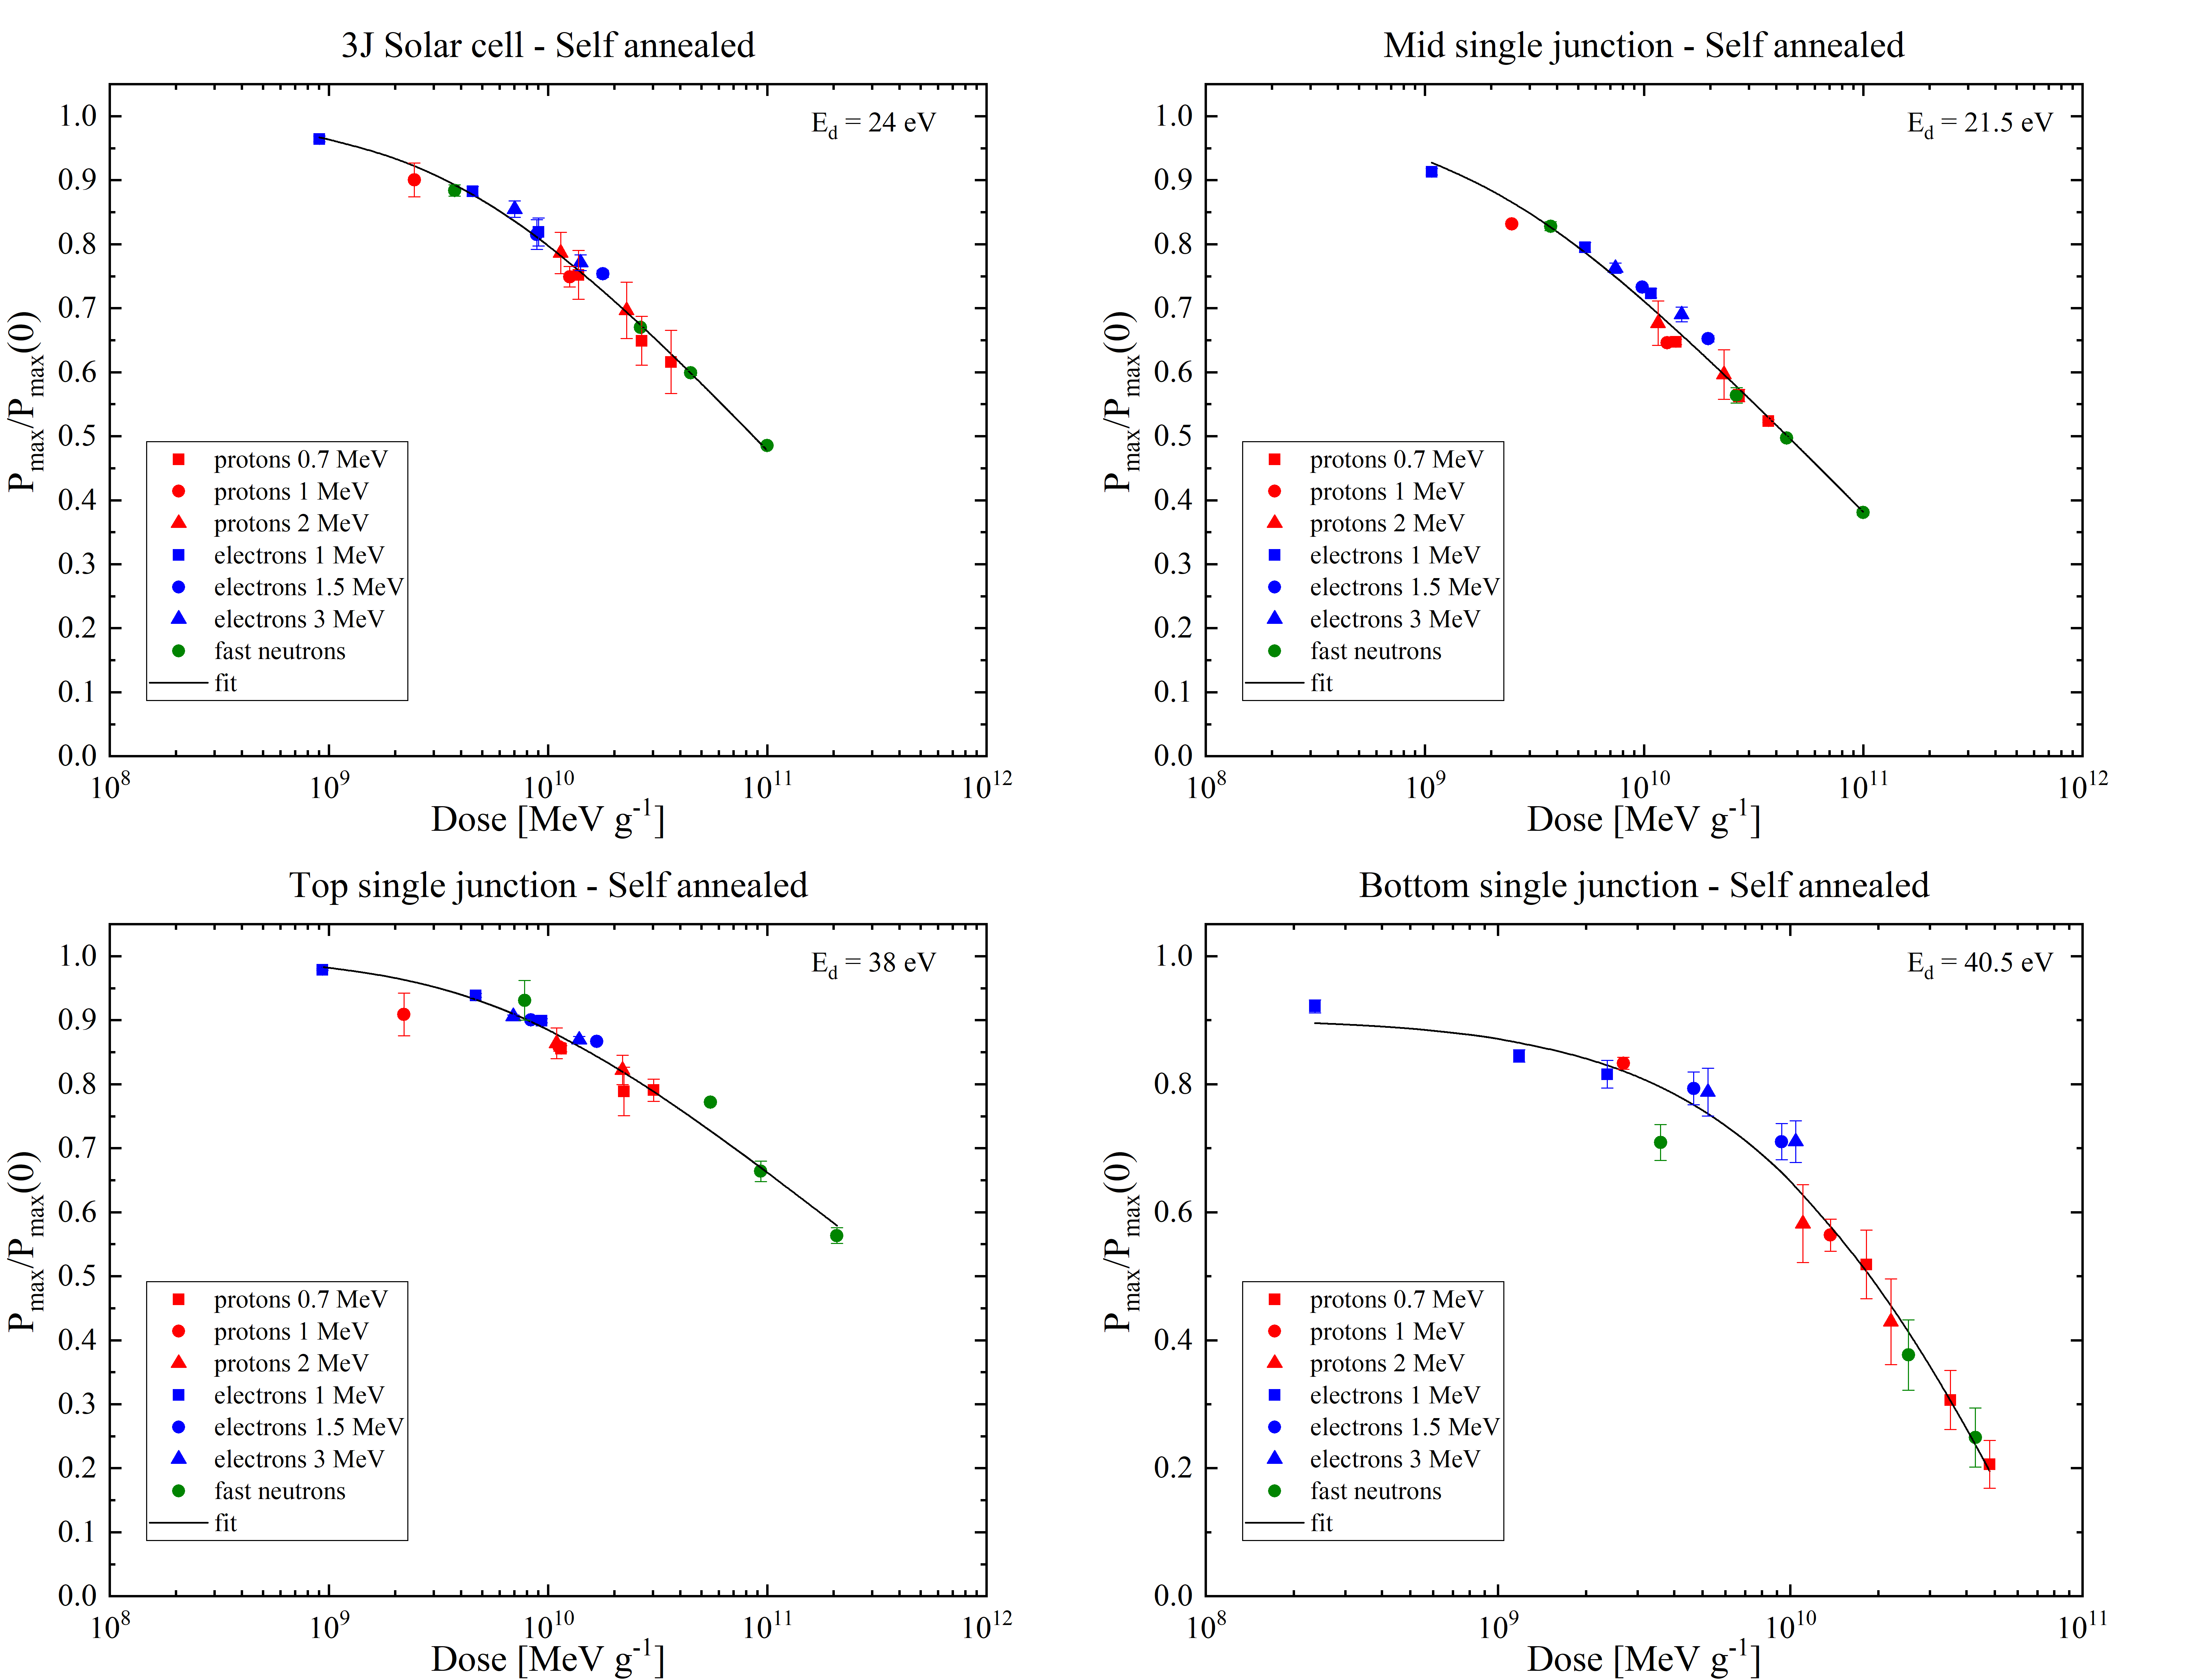
Optimal fit of Pmax degradation curve for InGaP/GaAs/Ge (TJ), GaAs (mid cell), InGaP (top cell) and Ge (bottom cell):
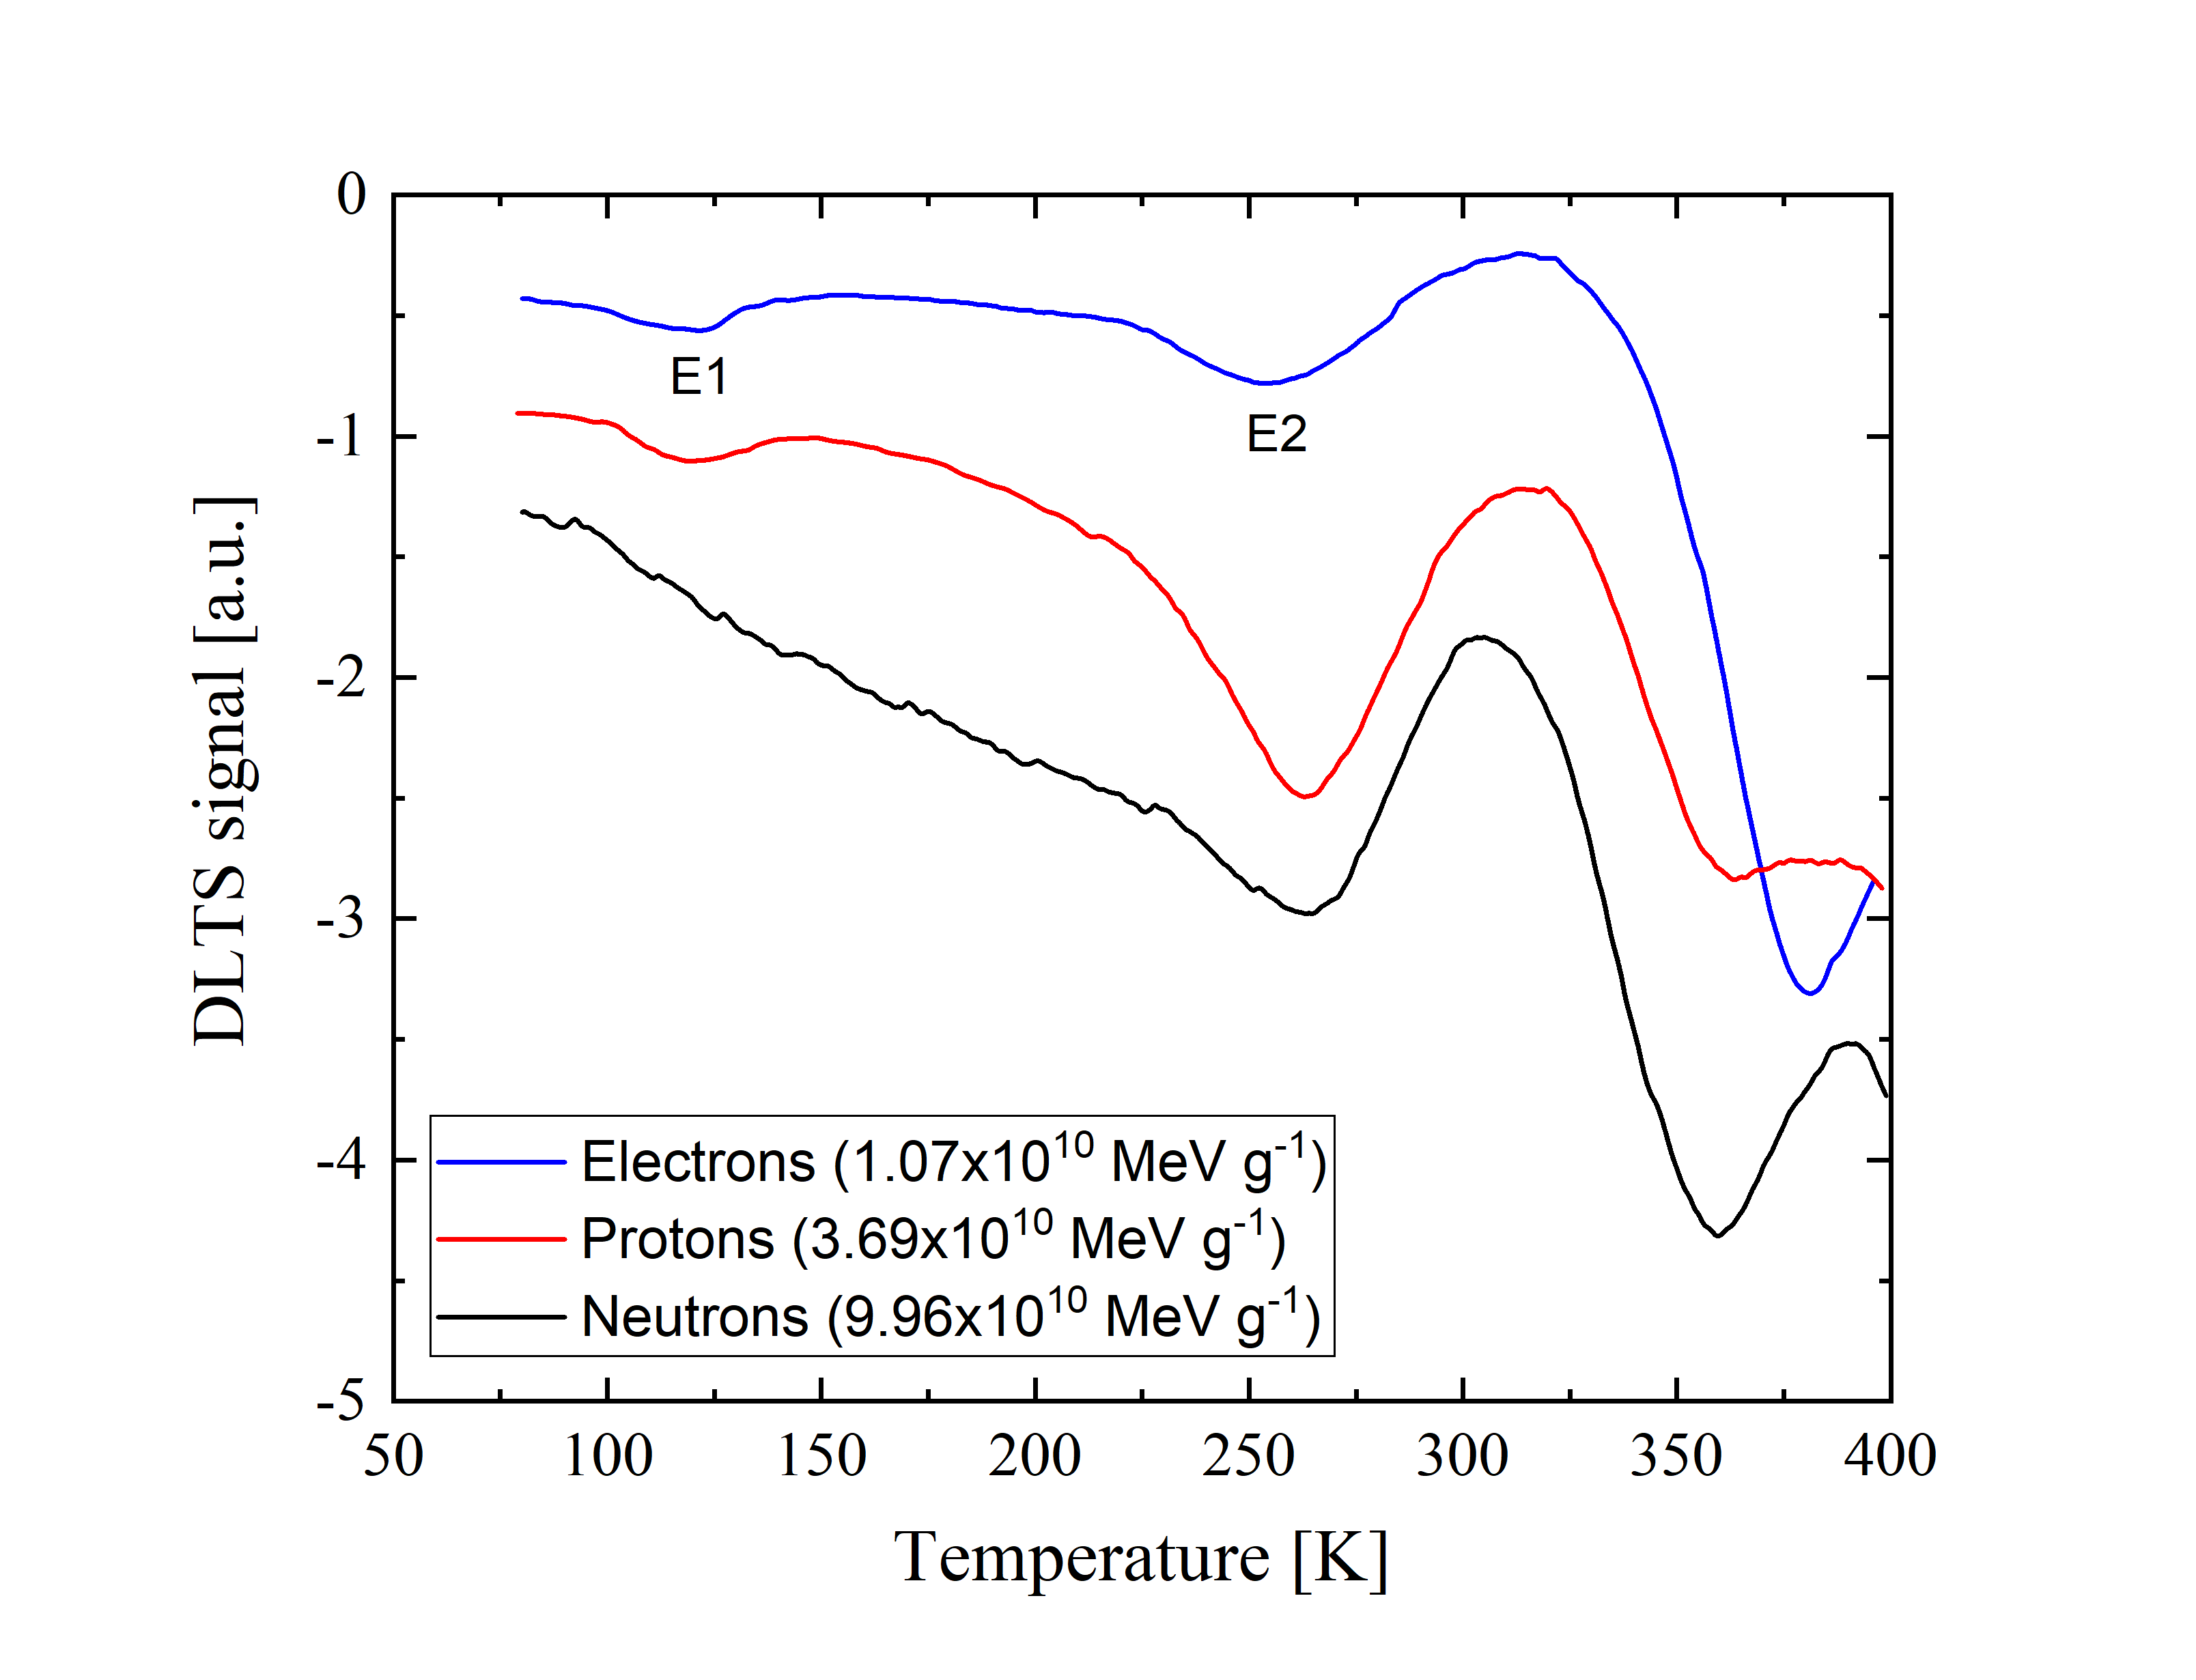
Comparison of the DLTS spectra of middle junctions irradiated by protons (3.69x10¹⁰ MeV g-1), electrons (1.07x10¹⁰ MeV g-1) and neutrons (9.96x10¹⁰ MeV g-1), respectively. Emission rate =46 s-1, pulse width=500 μs, reverse voltage Vr=-1.5 V, pulse voltage V1=-0.1 V:
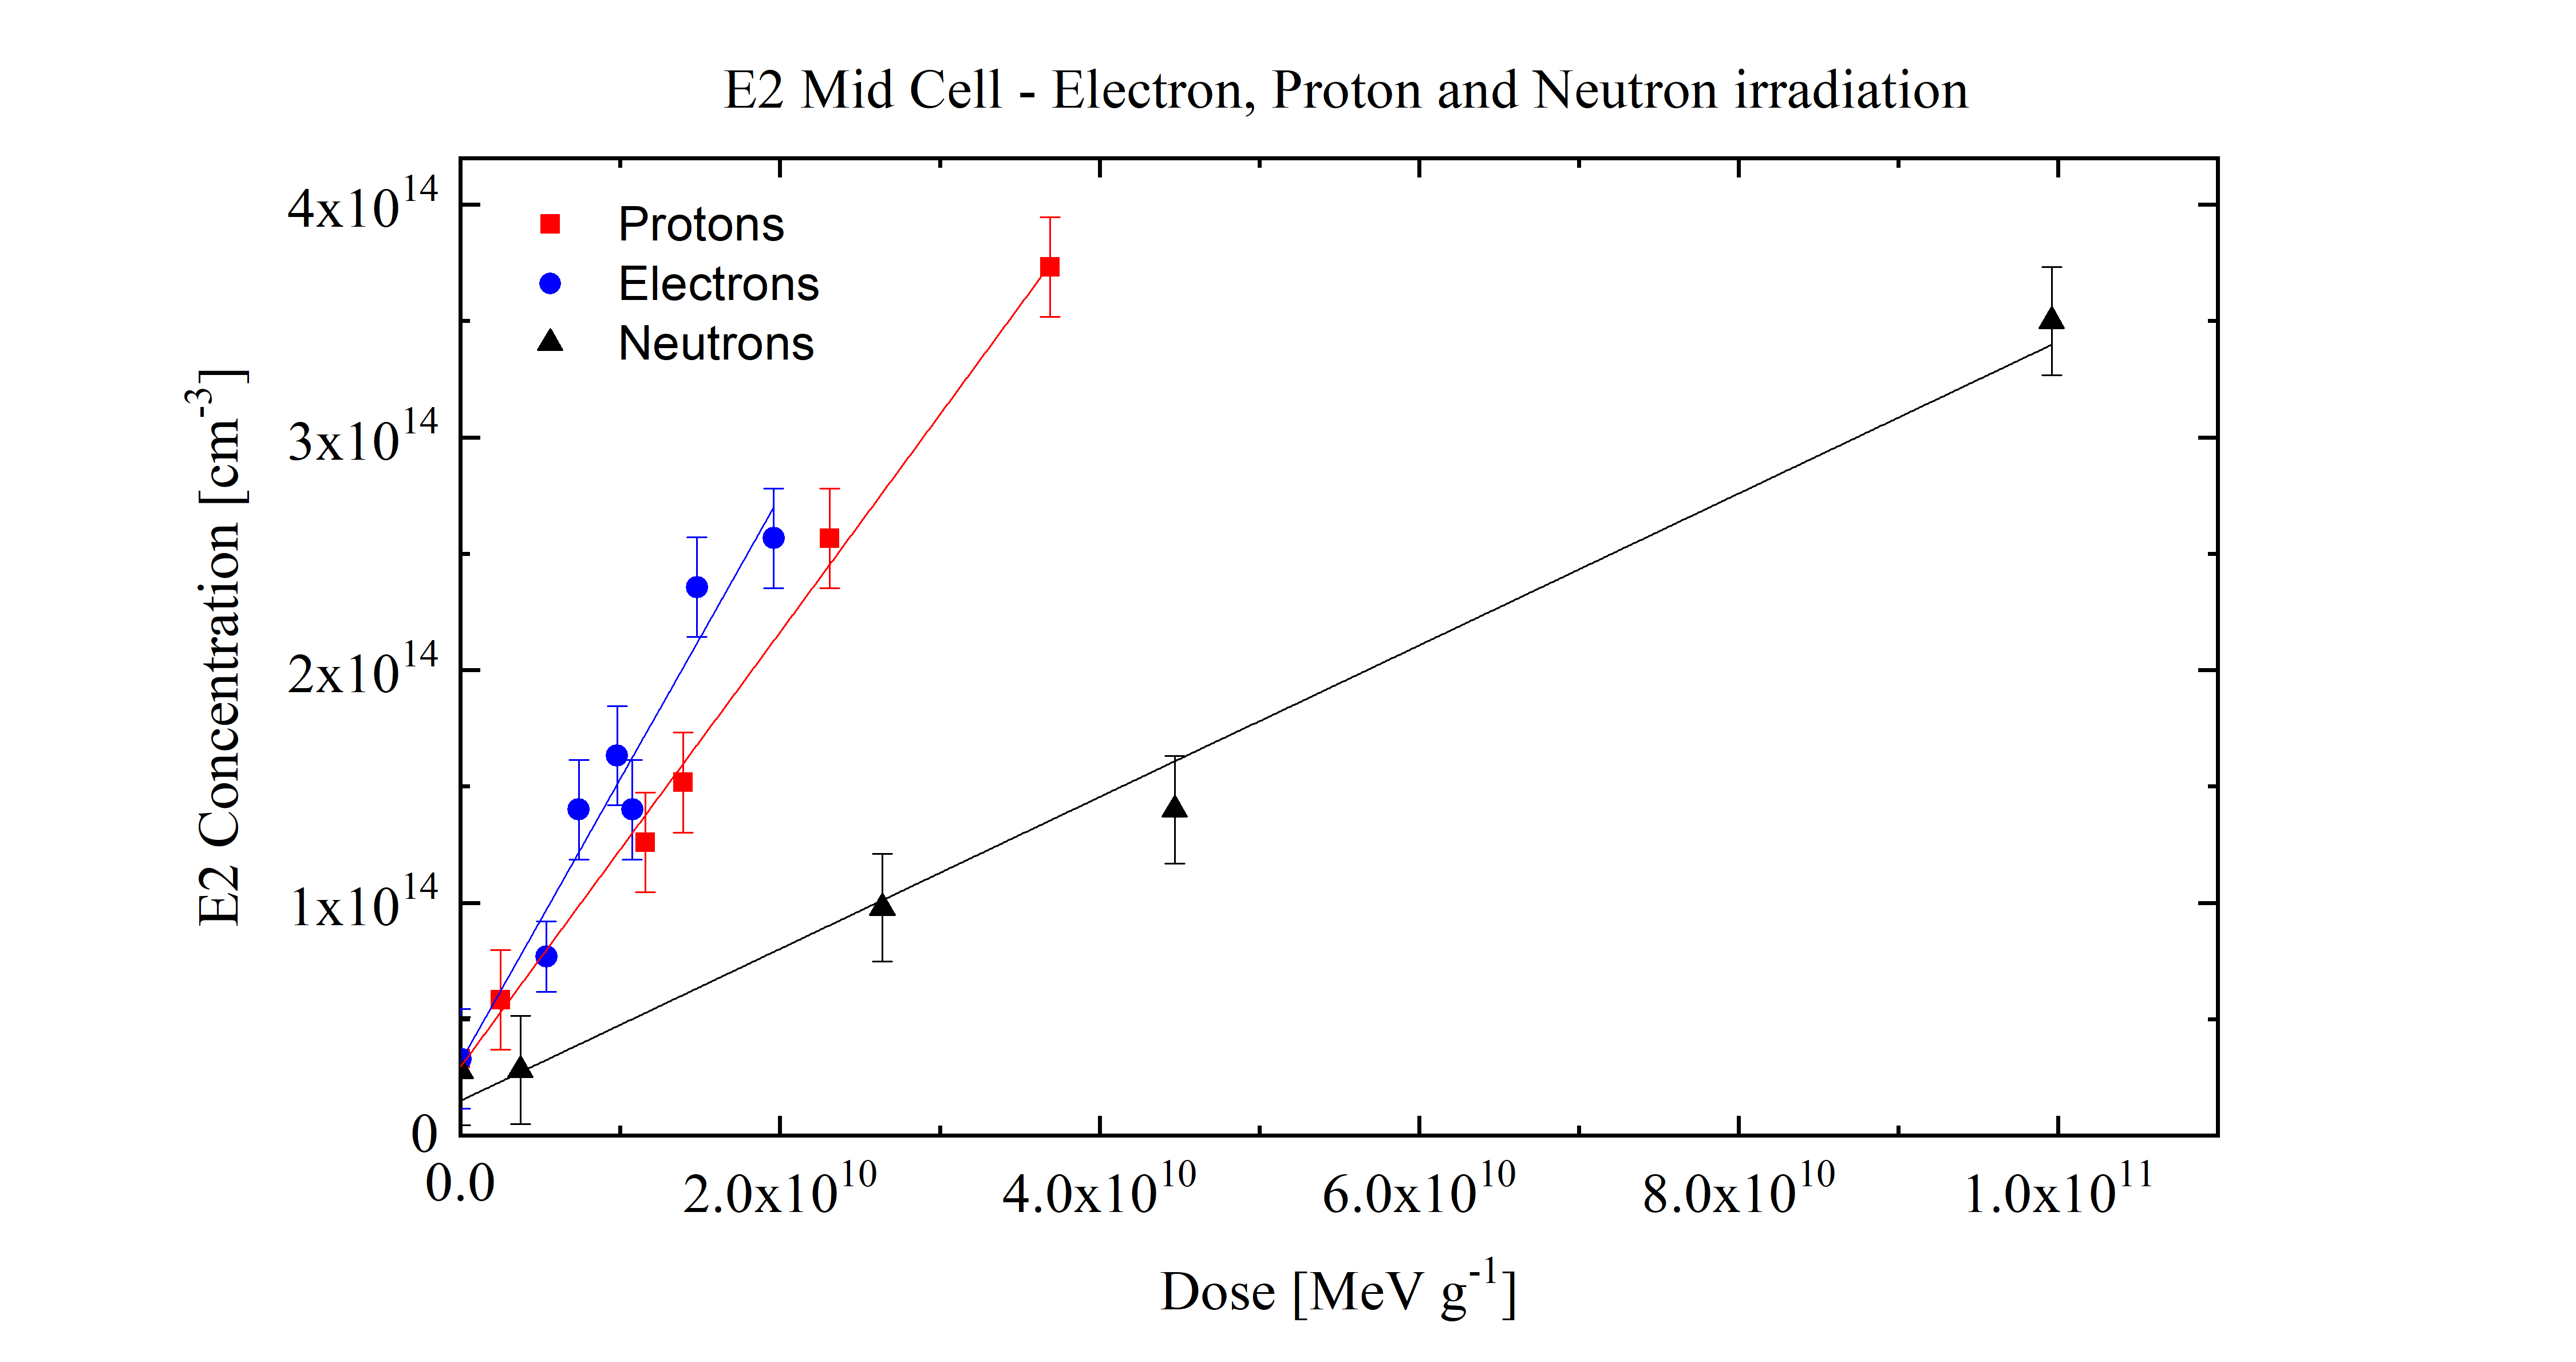
Concentration of E2 traps induced by irradiations with electrons, protons and neutrons in middle sub cell diodes as a function of DDD with Ed=21.5 eV:
From NIEL dose analisies on triple solar junctions: recent results (2018).
From R.Campesato et al. (2018).
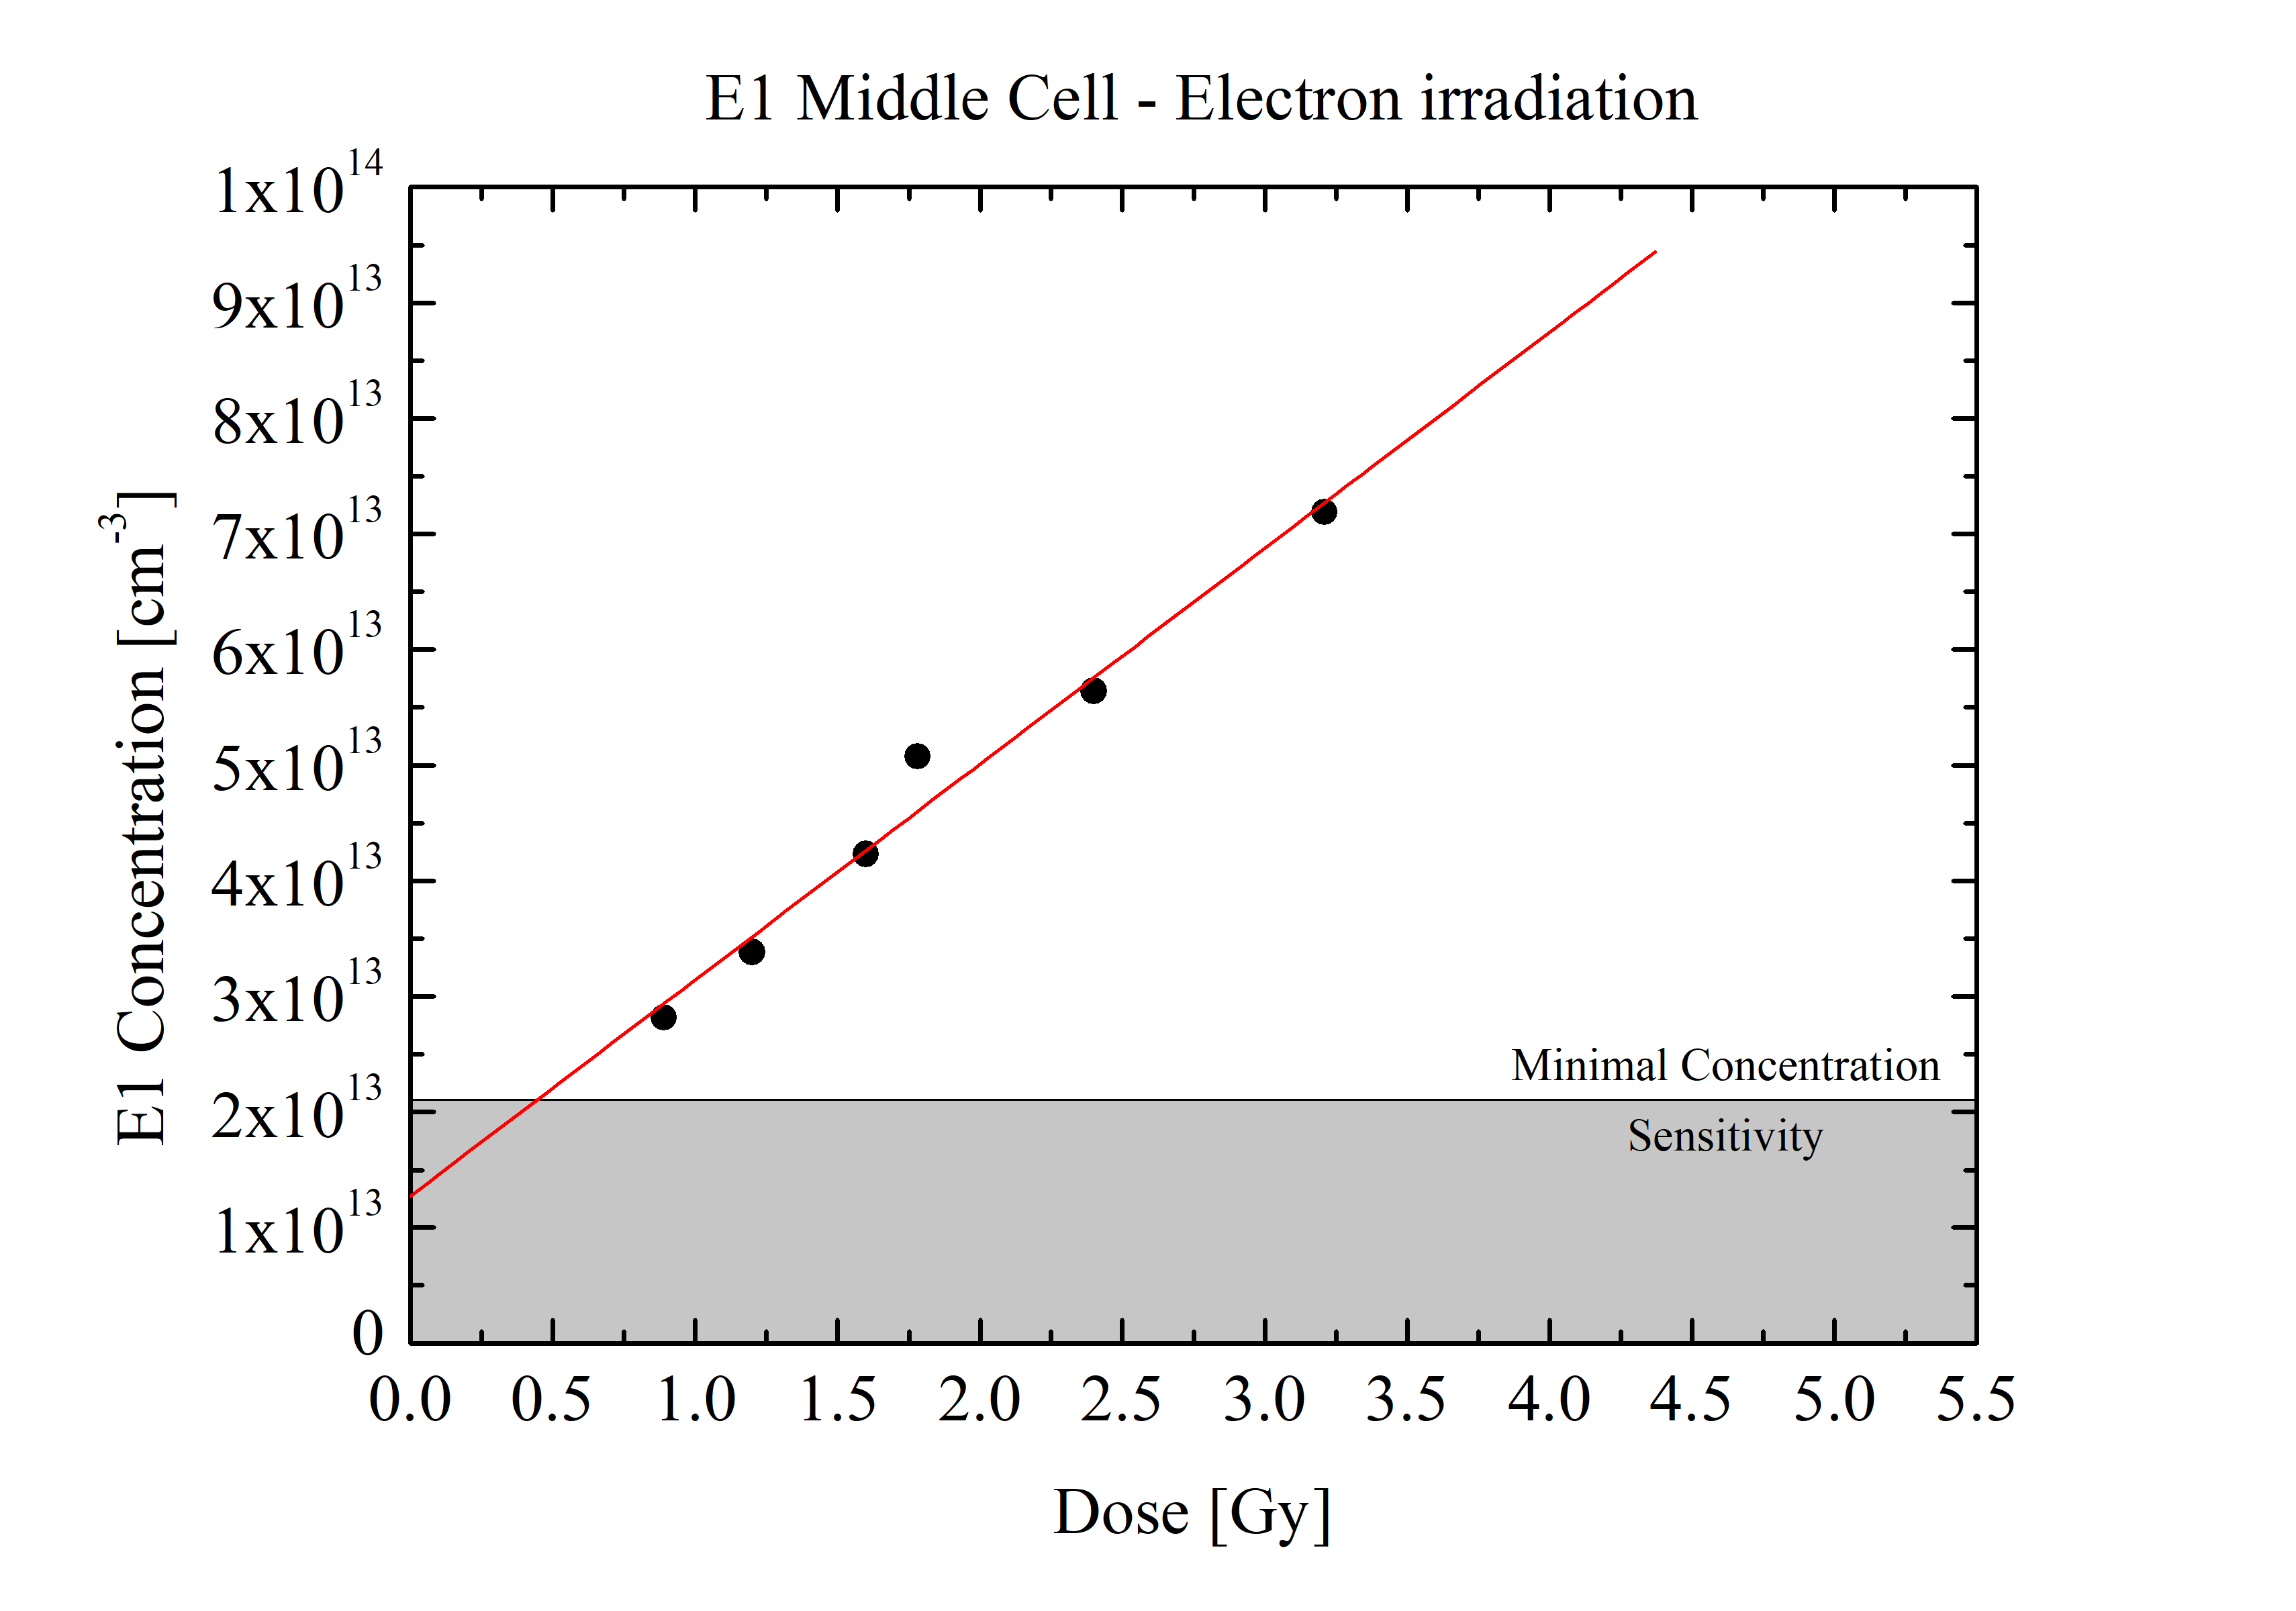
Concentration of E1 traps induced by electron irradiation in middle sub cell as a function of the displacement damage dose (obtained with Ed=21 eV):
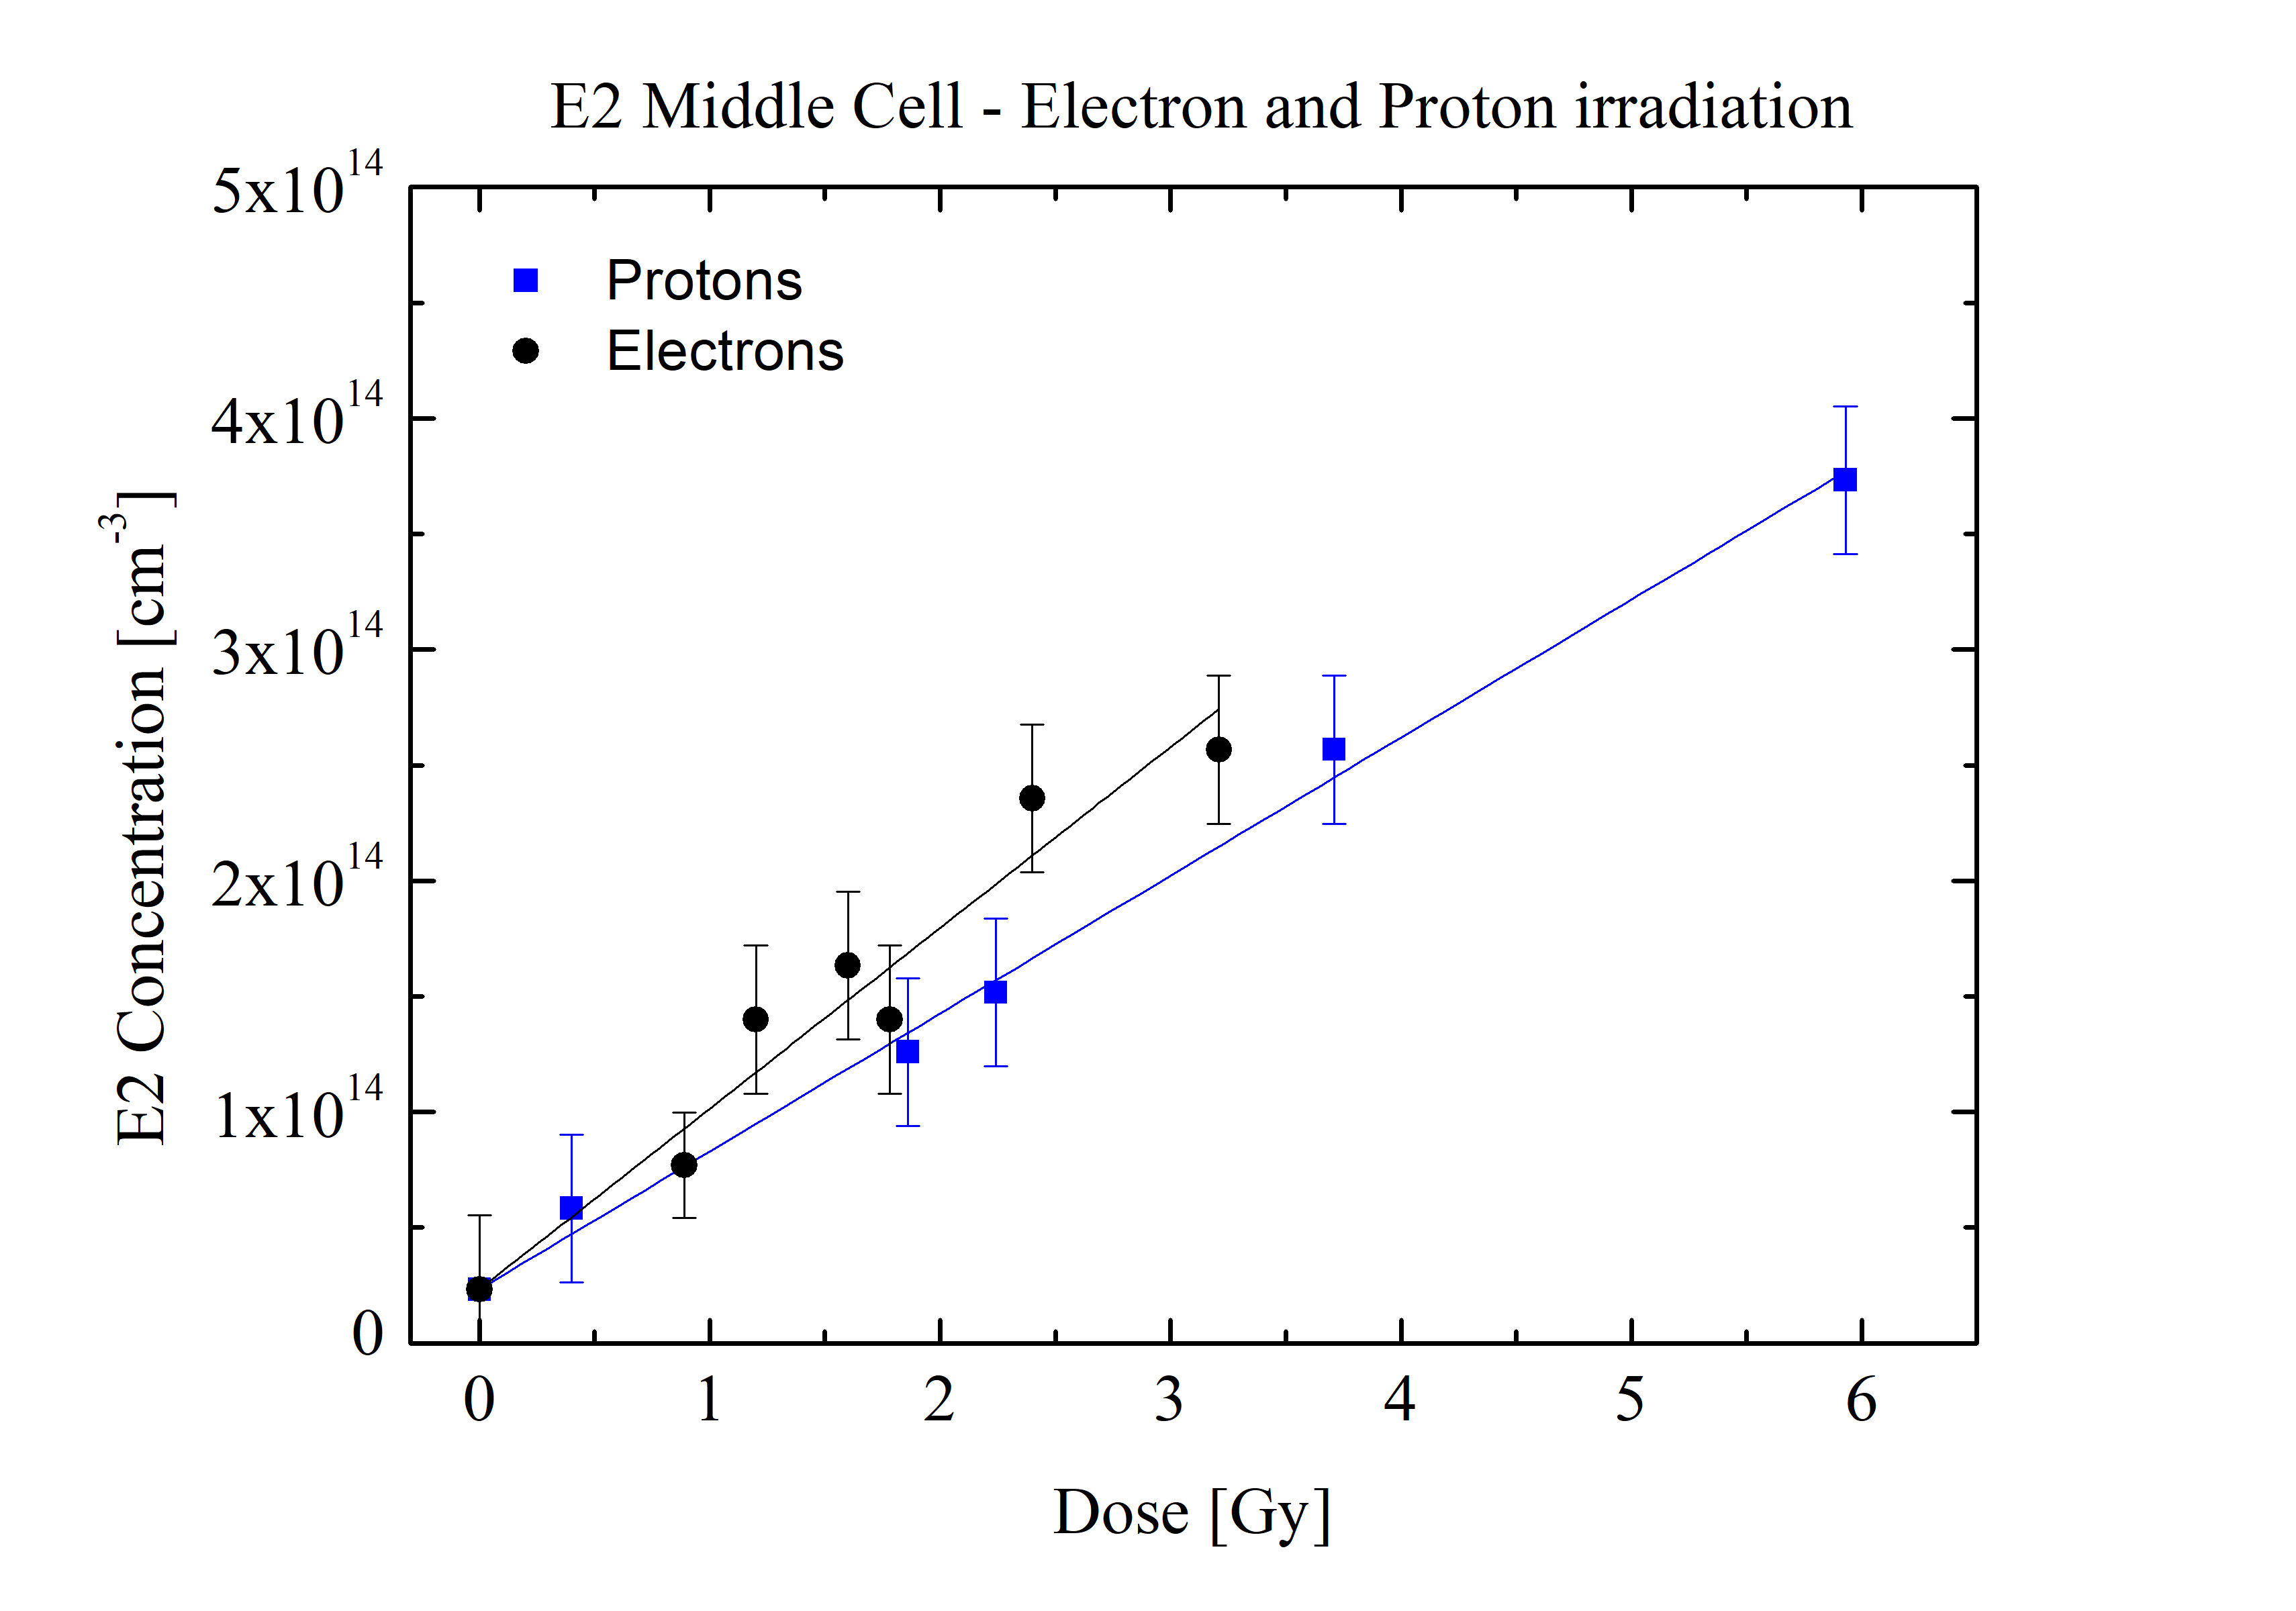
Concentration of E2 traps induced by electron and proton irradiation in middle sub cell as a function of the displacement damage dose (obtained with Ed=21 eV):
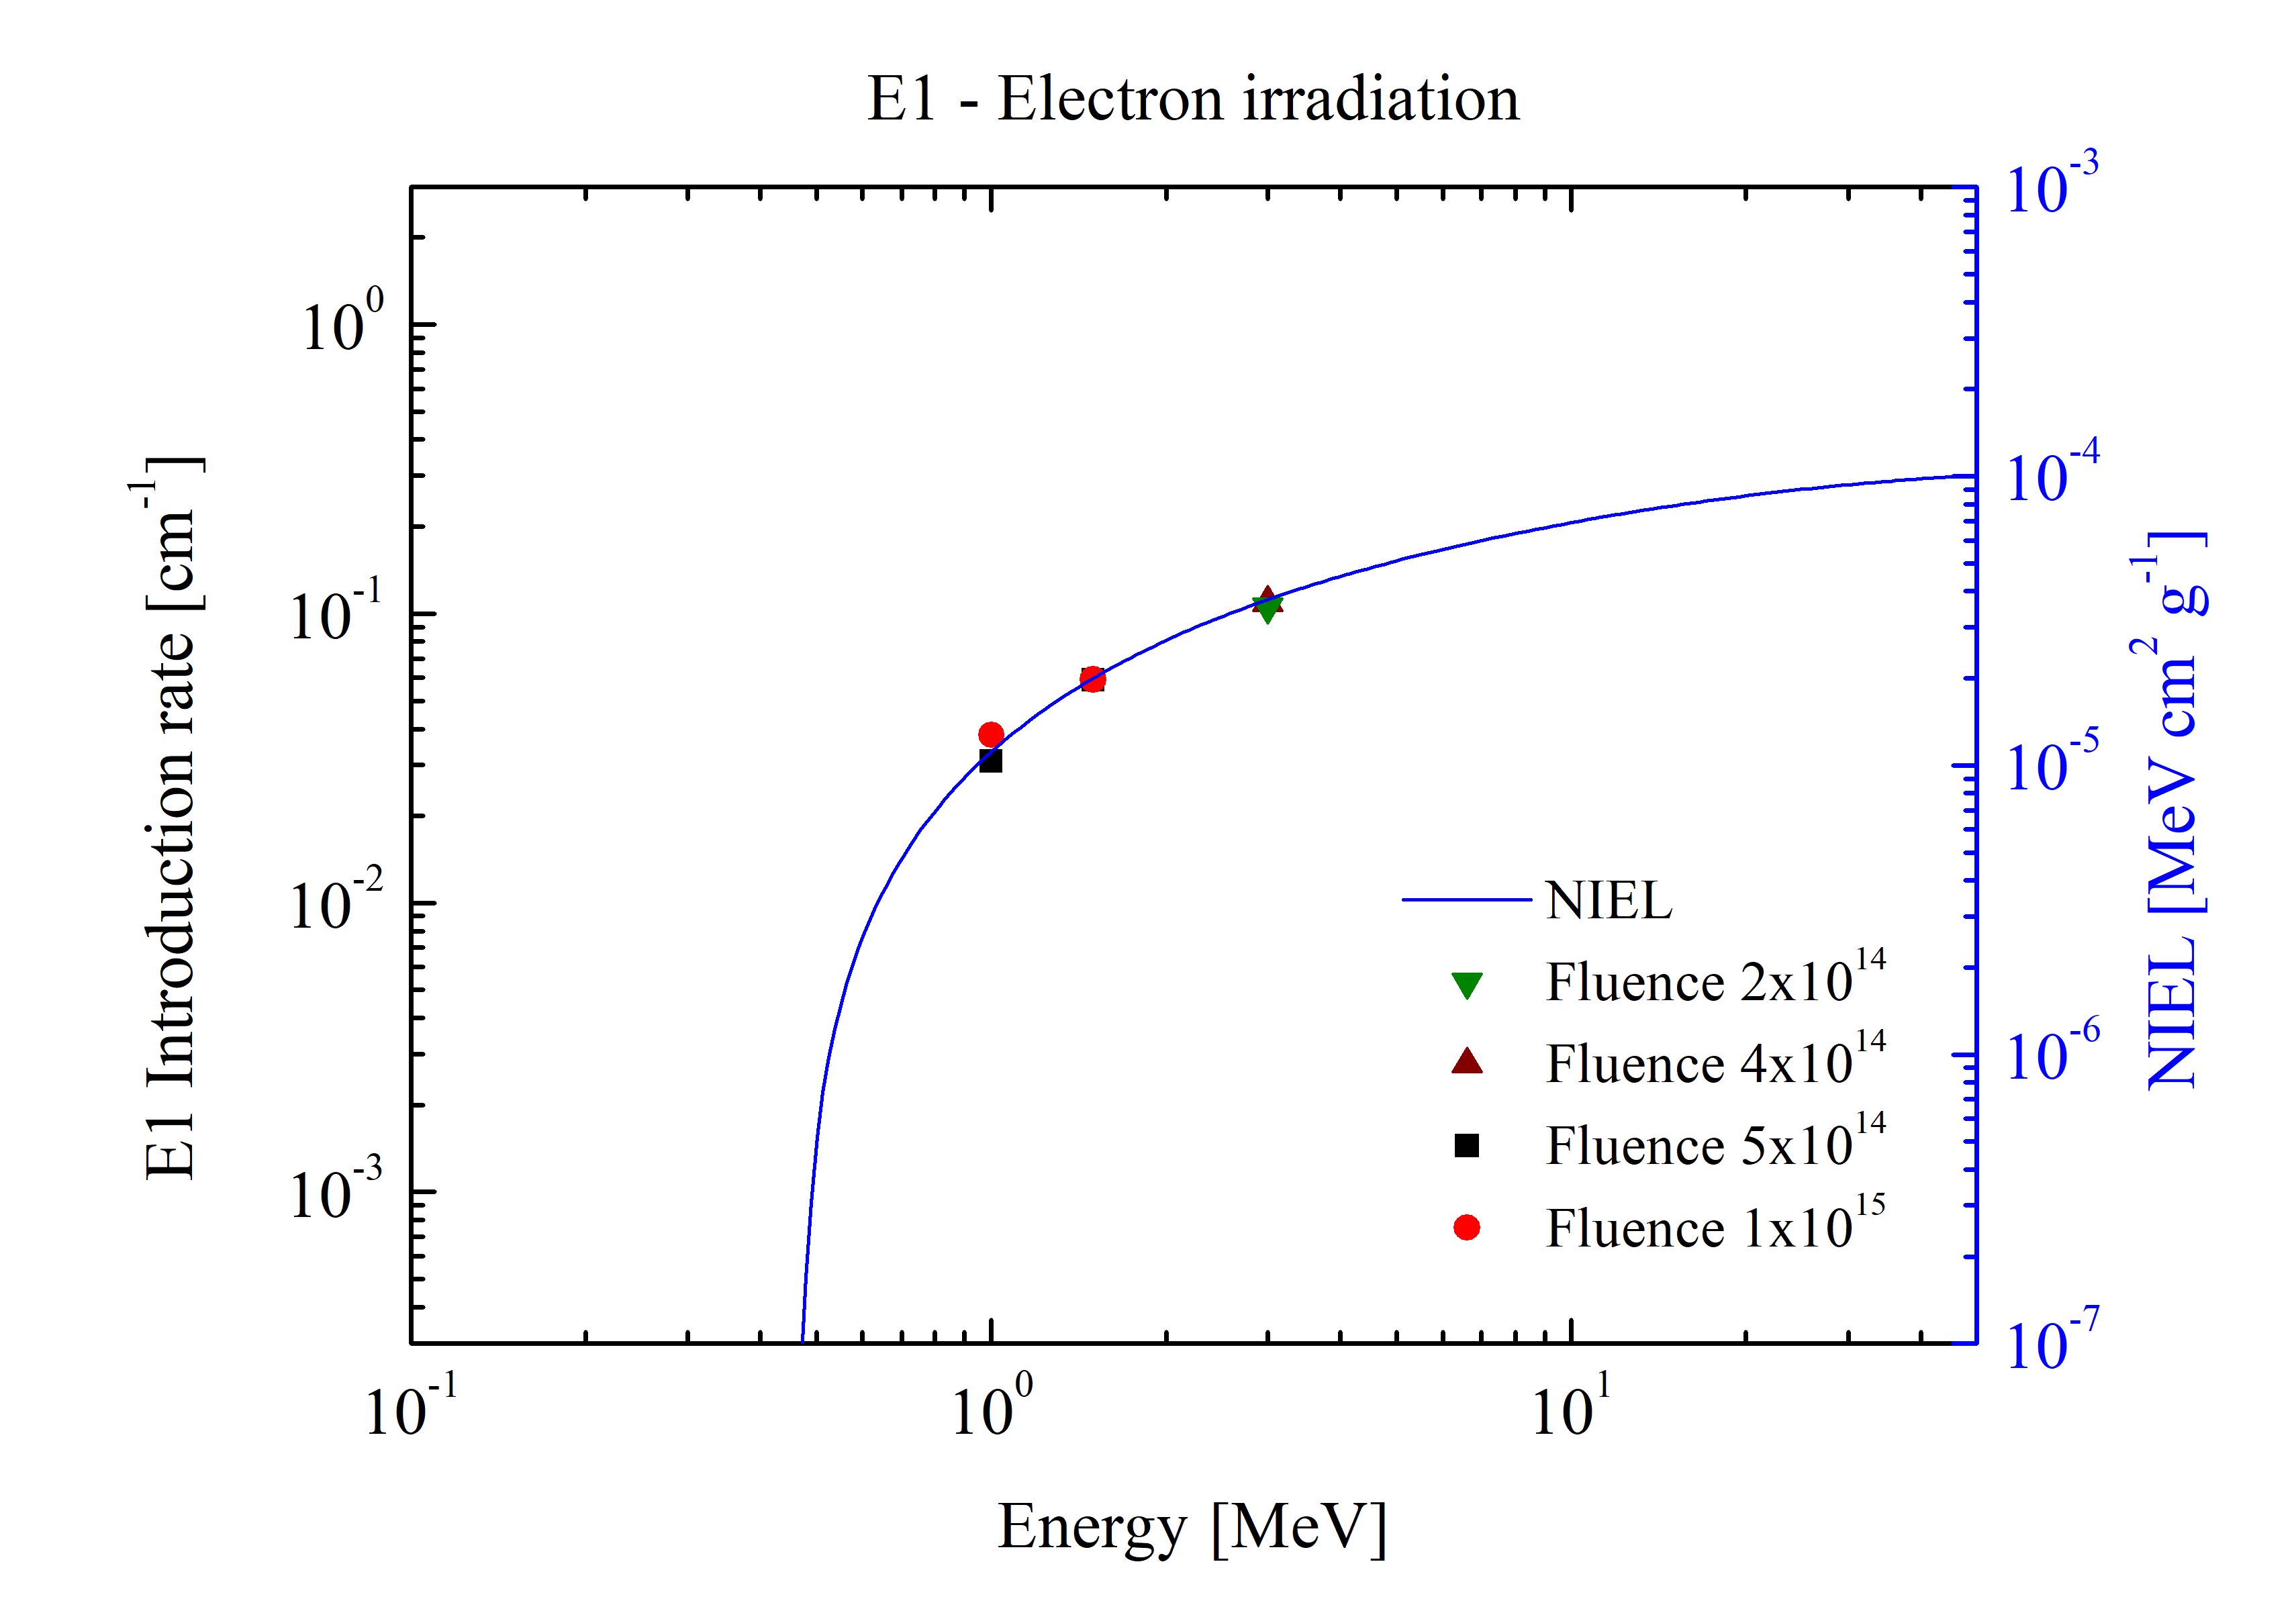
E1 traps introduction rate as a function of incoming electron energy: right scale NIEL values in GaAs sub cell for electrons.
E2 traps concentration rate as a function of incoming electron (top) and proton (bottom) energy: right scale NIEL values in GaAs sub cell for protons and electrons.
From C.Baur et al. (2017).
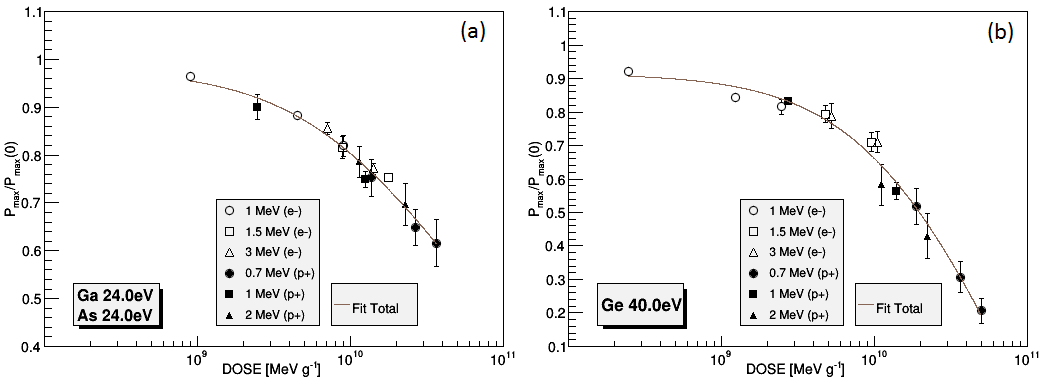
(a) Optimal fit of Pmax/Pmax(0) as function of the dose for the 3J solar cell;
(b) Optimal fit of Pmax/Pmax(0) as function of the dose for single junction bottom cell.
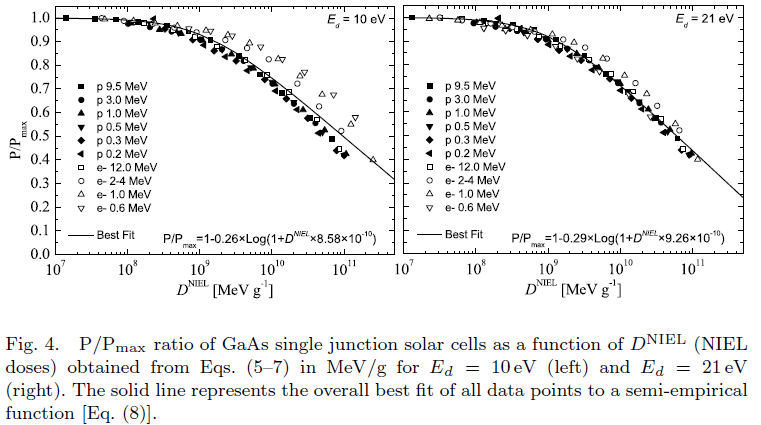
From C.Baur et al. (2014):
P/Pmax ratio of GaAs single junction solar cells as a function of the NIEL Dose obtained with SR-NIEL:
Electronic stopping power and restricted energy loss in SR-framework
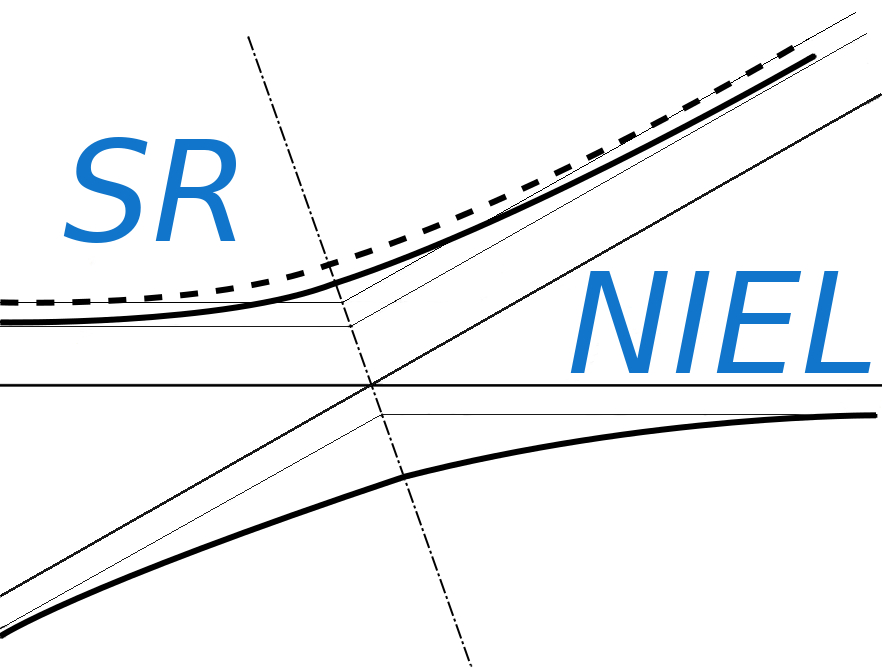
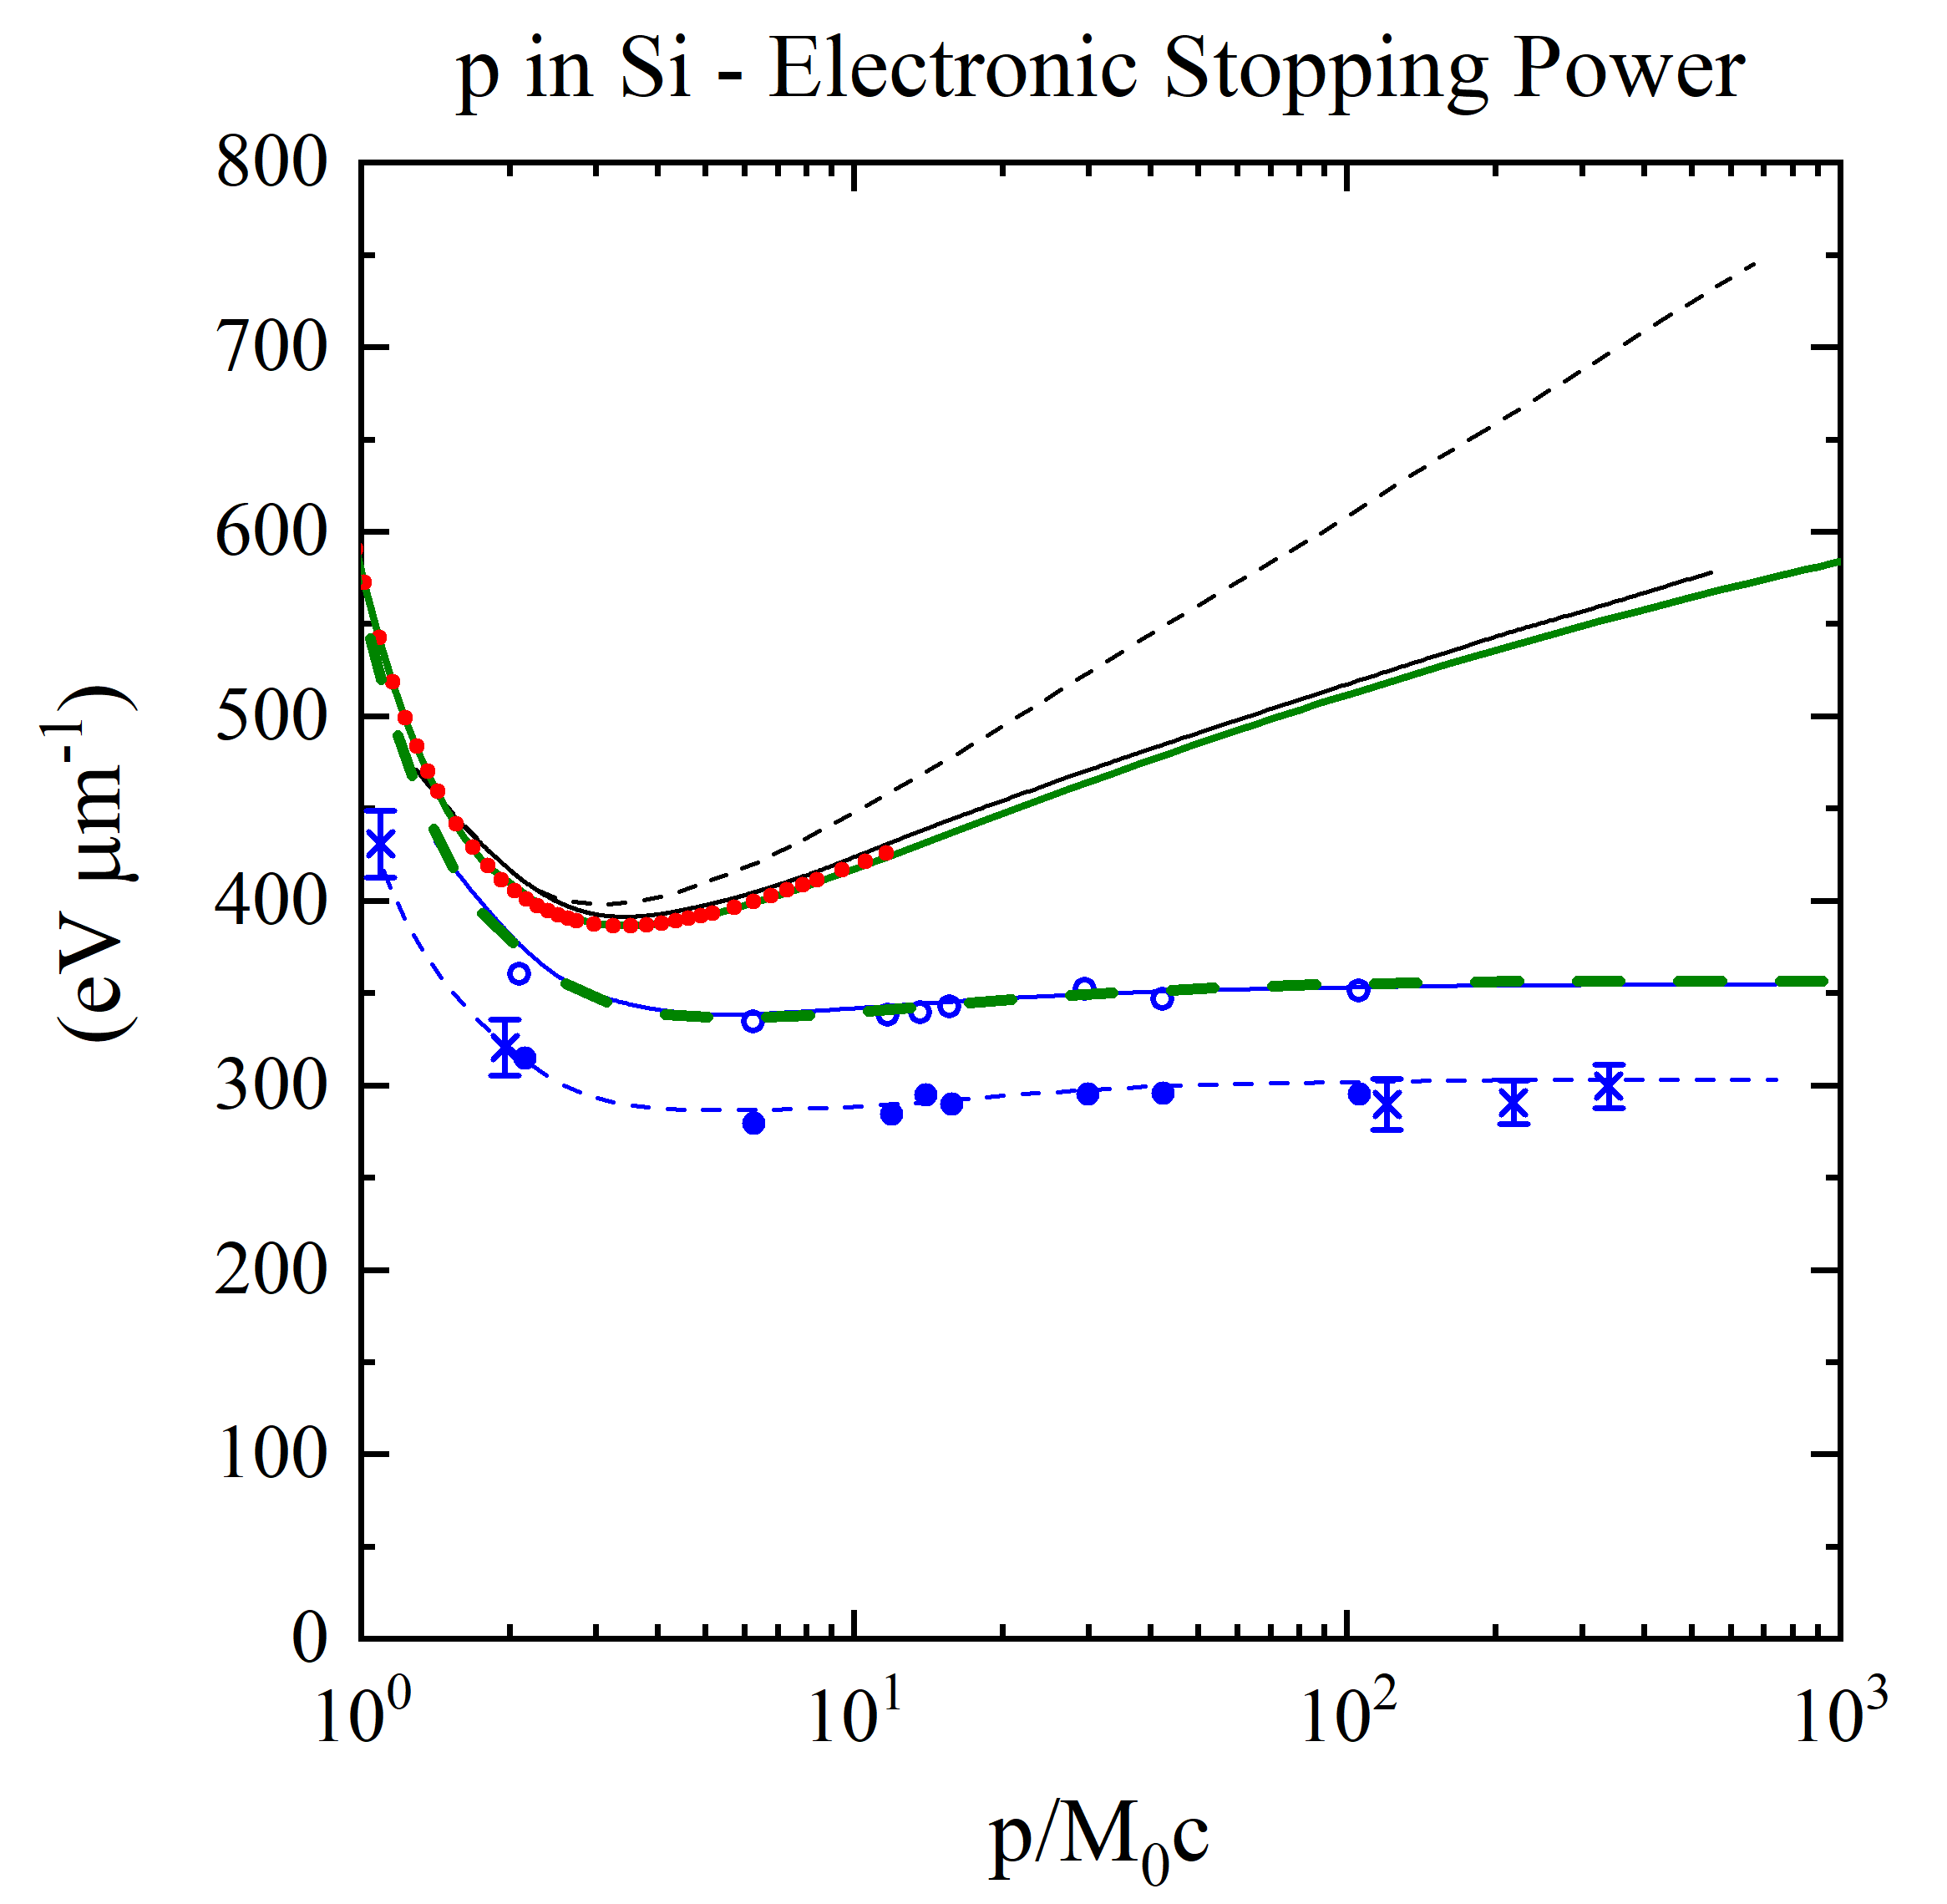 Energy loss in silicon (in units of eV/μm) versus βγ (= p/M0c, where M0 and p are the rest mass and the momentum of the incoming particle with z=1) (see also [Rancoita (1984)]). From the top, the first two curves are: the stopping power without (broken curve) and with (full curve) the density-effect correction (e.g., see Chapter 2 of [Leroy and Rancoita (2016)]) . The red points for incoming protons up to 10 GeV (βγ =11.61) are obtained from the electronic stopping power SRIM calculator currently implemented in this website. The solid green curve for incoming protons was obtained from the SR-framework electronic stopping implemented in this website: for proton energies larger than about 16.7 MeV it agrees agrees with SRIM within about 0.5% (see Figure 6 here). For protons with energy of about 510 GeV (βγ around 550), the difference between the electronic stopping power from SR-framework and that from Esbensen calculation (black solid curve) is 1.86%. The dashed green curve was obtained from the present SR-framework restricted energy loss with W0=500 keV (in agreement with the value discussed at page 73 of [Leroy and Rancoita (2016)]). The following two other curves - compared to experimental data for detector thicknesses of 300 (× from [Hancock, James, Movchet, Rancoita and Van Rossum (1983)]) and 900 μm (◦ and • from [Esbensen et al. (1978)]) - are, respectively, i ) the top one (solid line in blue) for the restricted energy-loss with the density-effect taken into account and ii) the bottom one (dashed line in blue) for prediction of the most probable energy-loss. Furthermore (as discussed at page 82 of [Leroy and Rancoita (2016)]), for βγ > 100, in 300 μm thick silicon detector the observed most probable energy-loss (in eV/μm) is about 5% lower than that in 900 μm thick silicon detetor in agreement, within the experimental errors, with the decrease of about 6.5% calculated by means of Eq. (2.56) at page 81 of [Leroy and Rancoita (2016)].
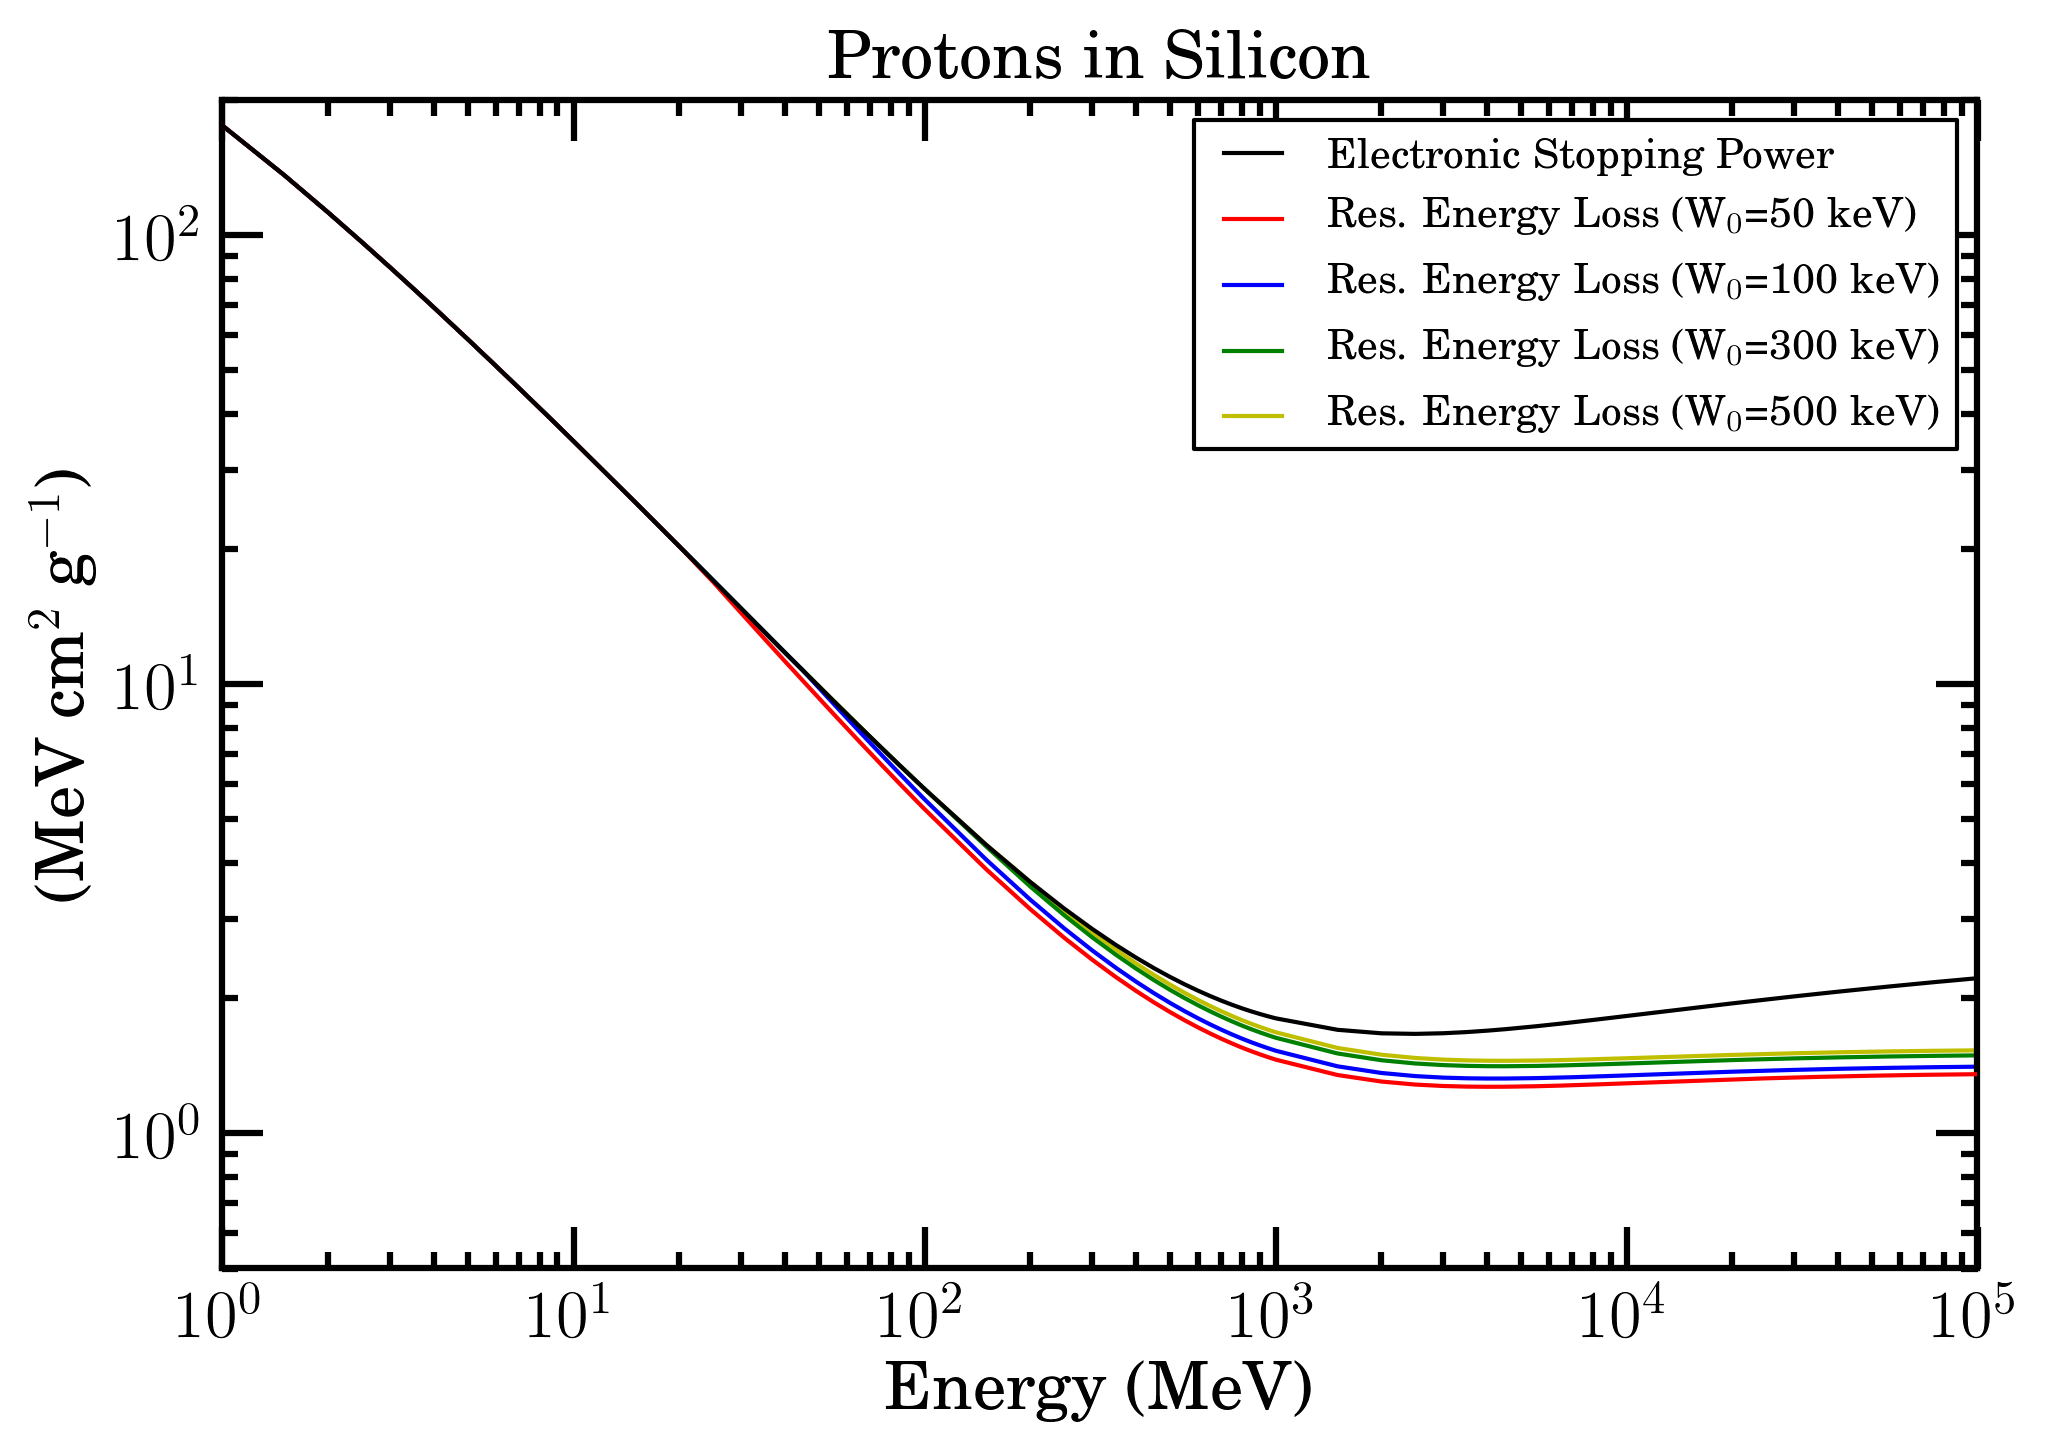 Electronic stopping power (black curve) and restricted energy loss with W0=50 keV (red curve), W0=100 keV (blue curve), W0=300 keV (green curve) and W0=500 keV (yellow curve) as a function of energy for protons in Silicon in SR-Framework.
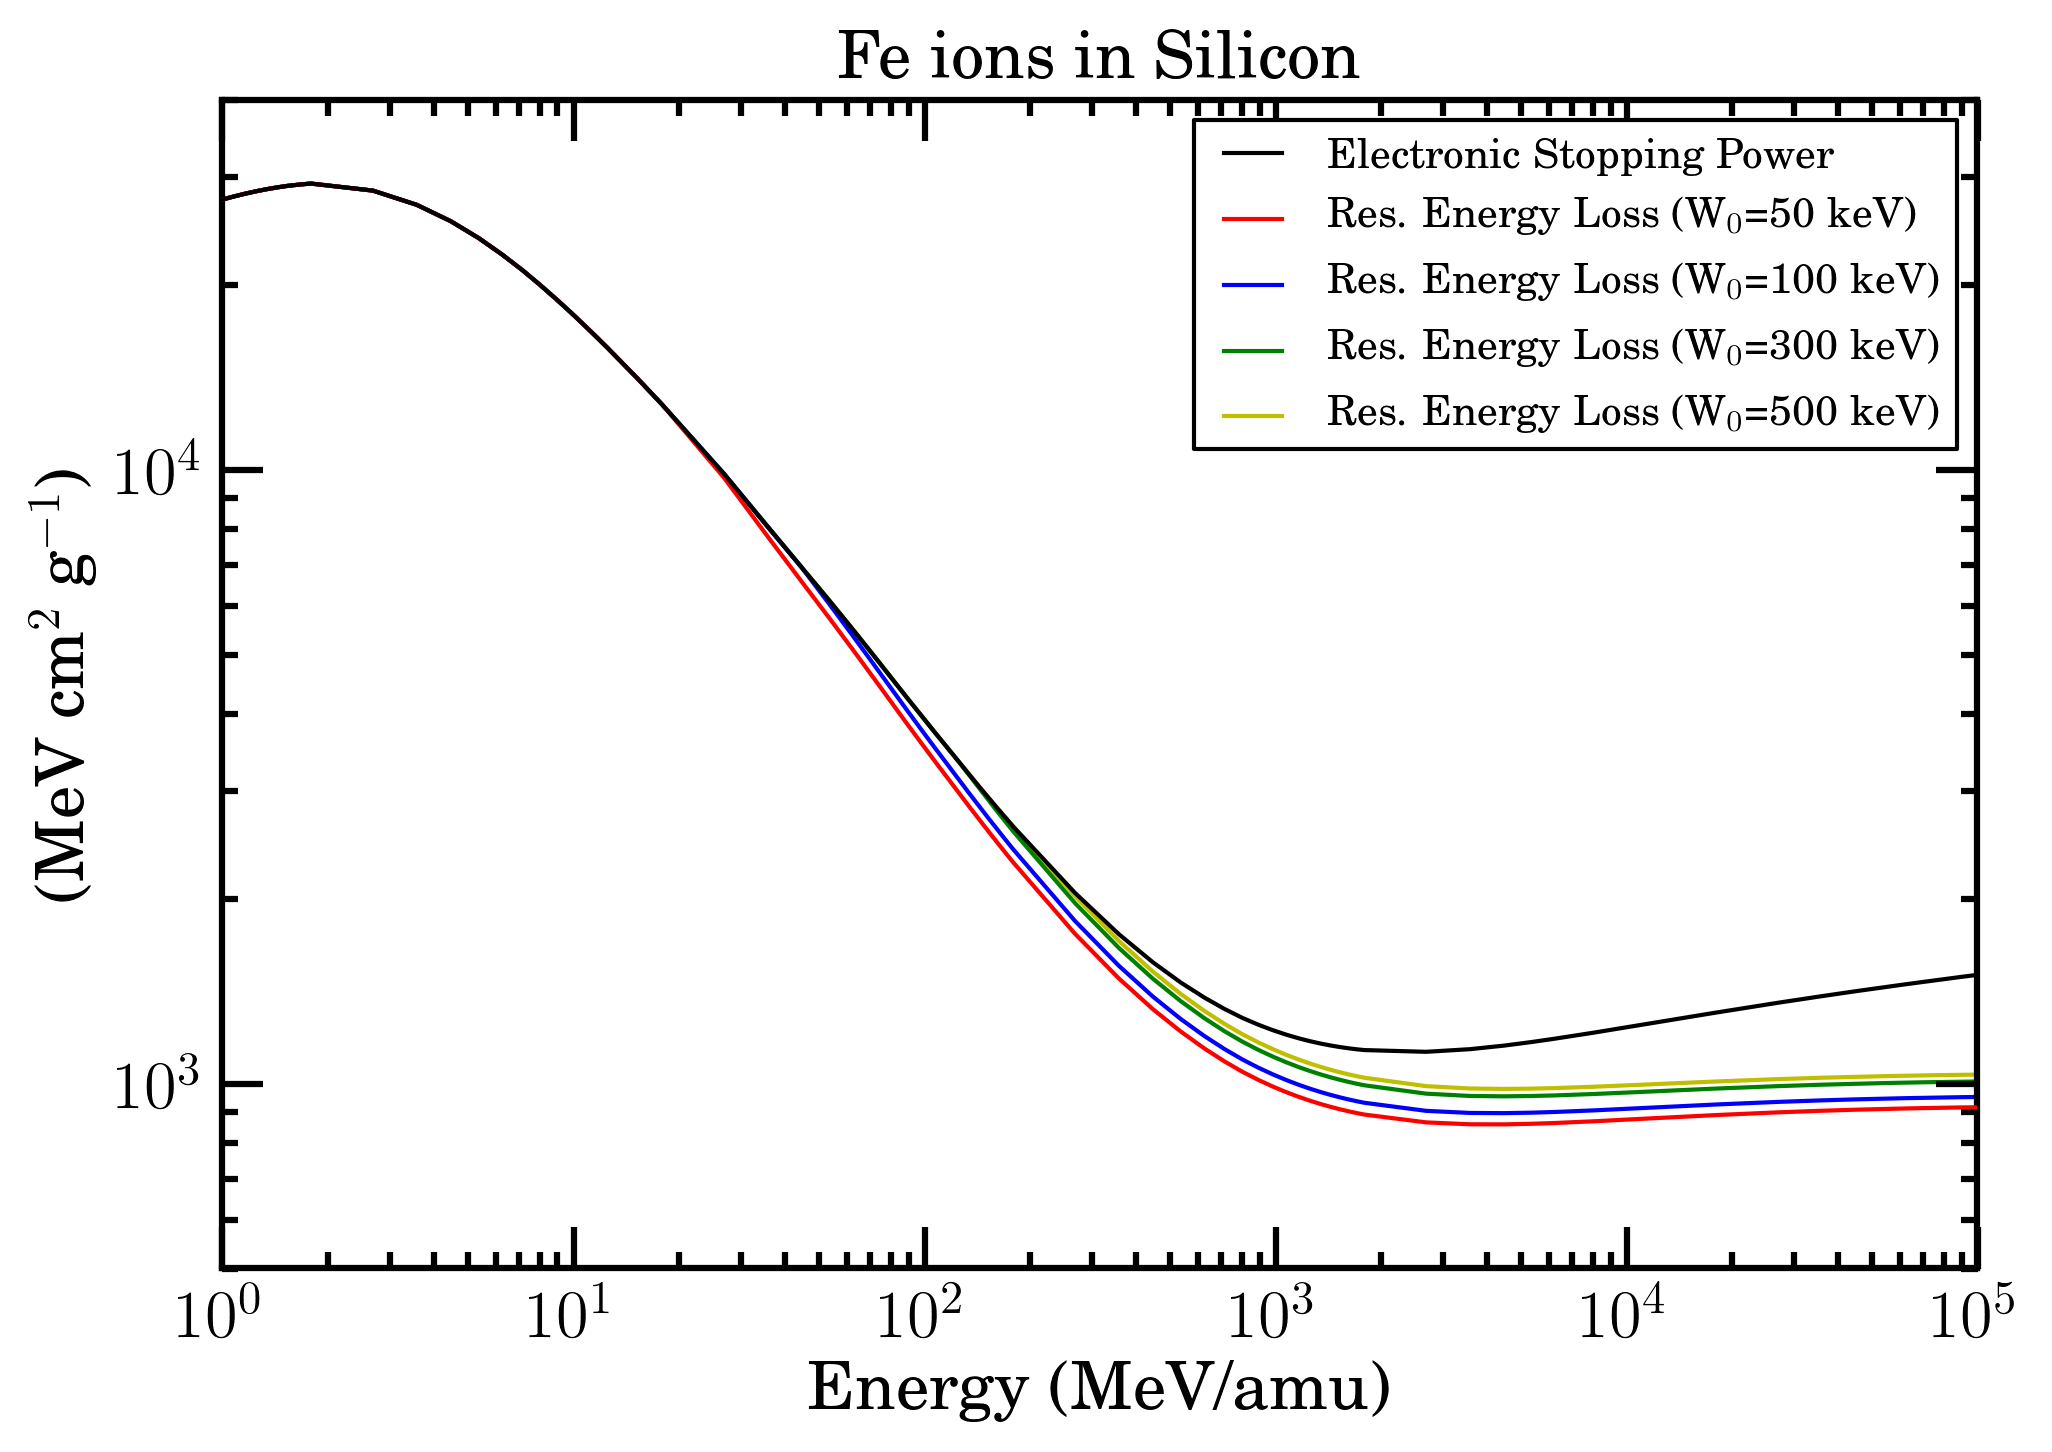 Electronic stopping power (black curve) and restricted energy loss with W0=50 keV (red curve), W0=100 keV (blue curve), W0=300 keV (green curve) and W0=500 keV (yellow curve) as a function of energy/amu for Fe ions in Silicon in SR-Framework.
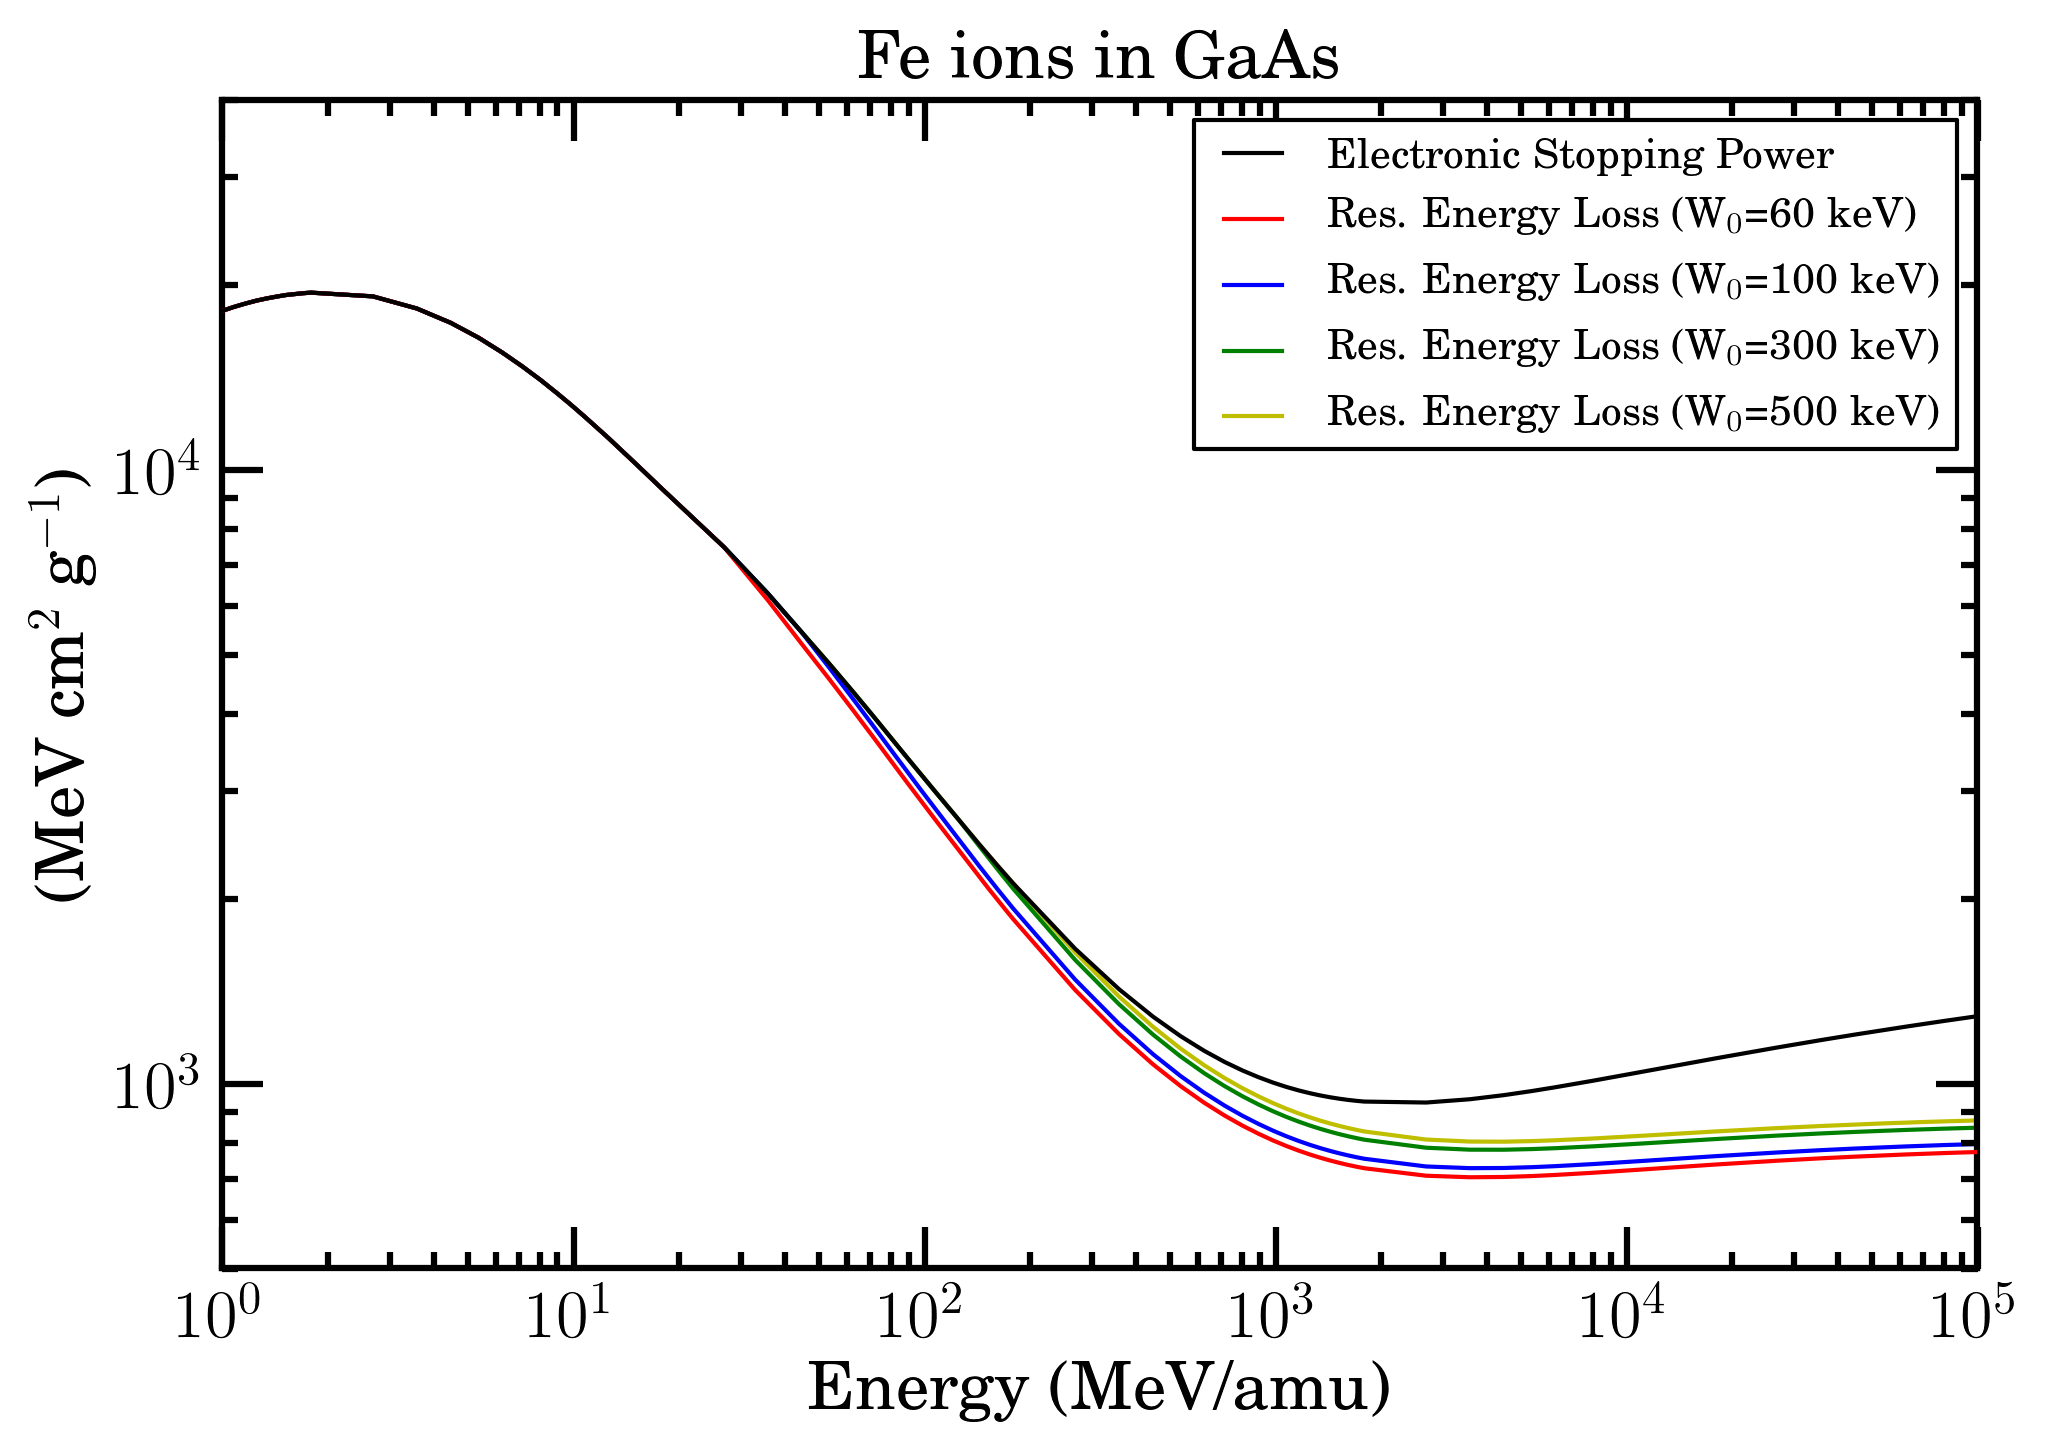 Electronic stopping power (black curve) and restricted energy loss with W0=60 keV (red curve), W0=100 keV (blue curve), W0=300 keV (green curve) and W0=500 keV (yellow curve) as a function of energy/amu for Fe ions in Gallium Arsenide in SR-Framework.
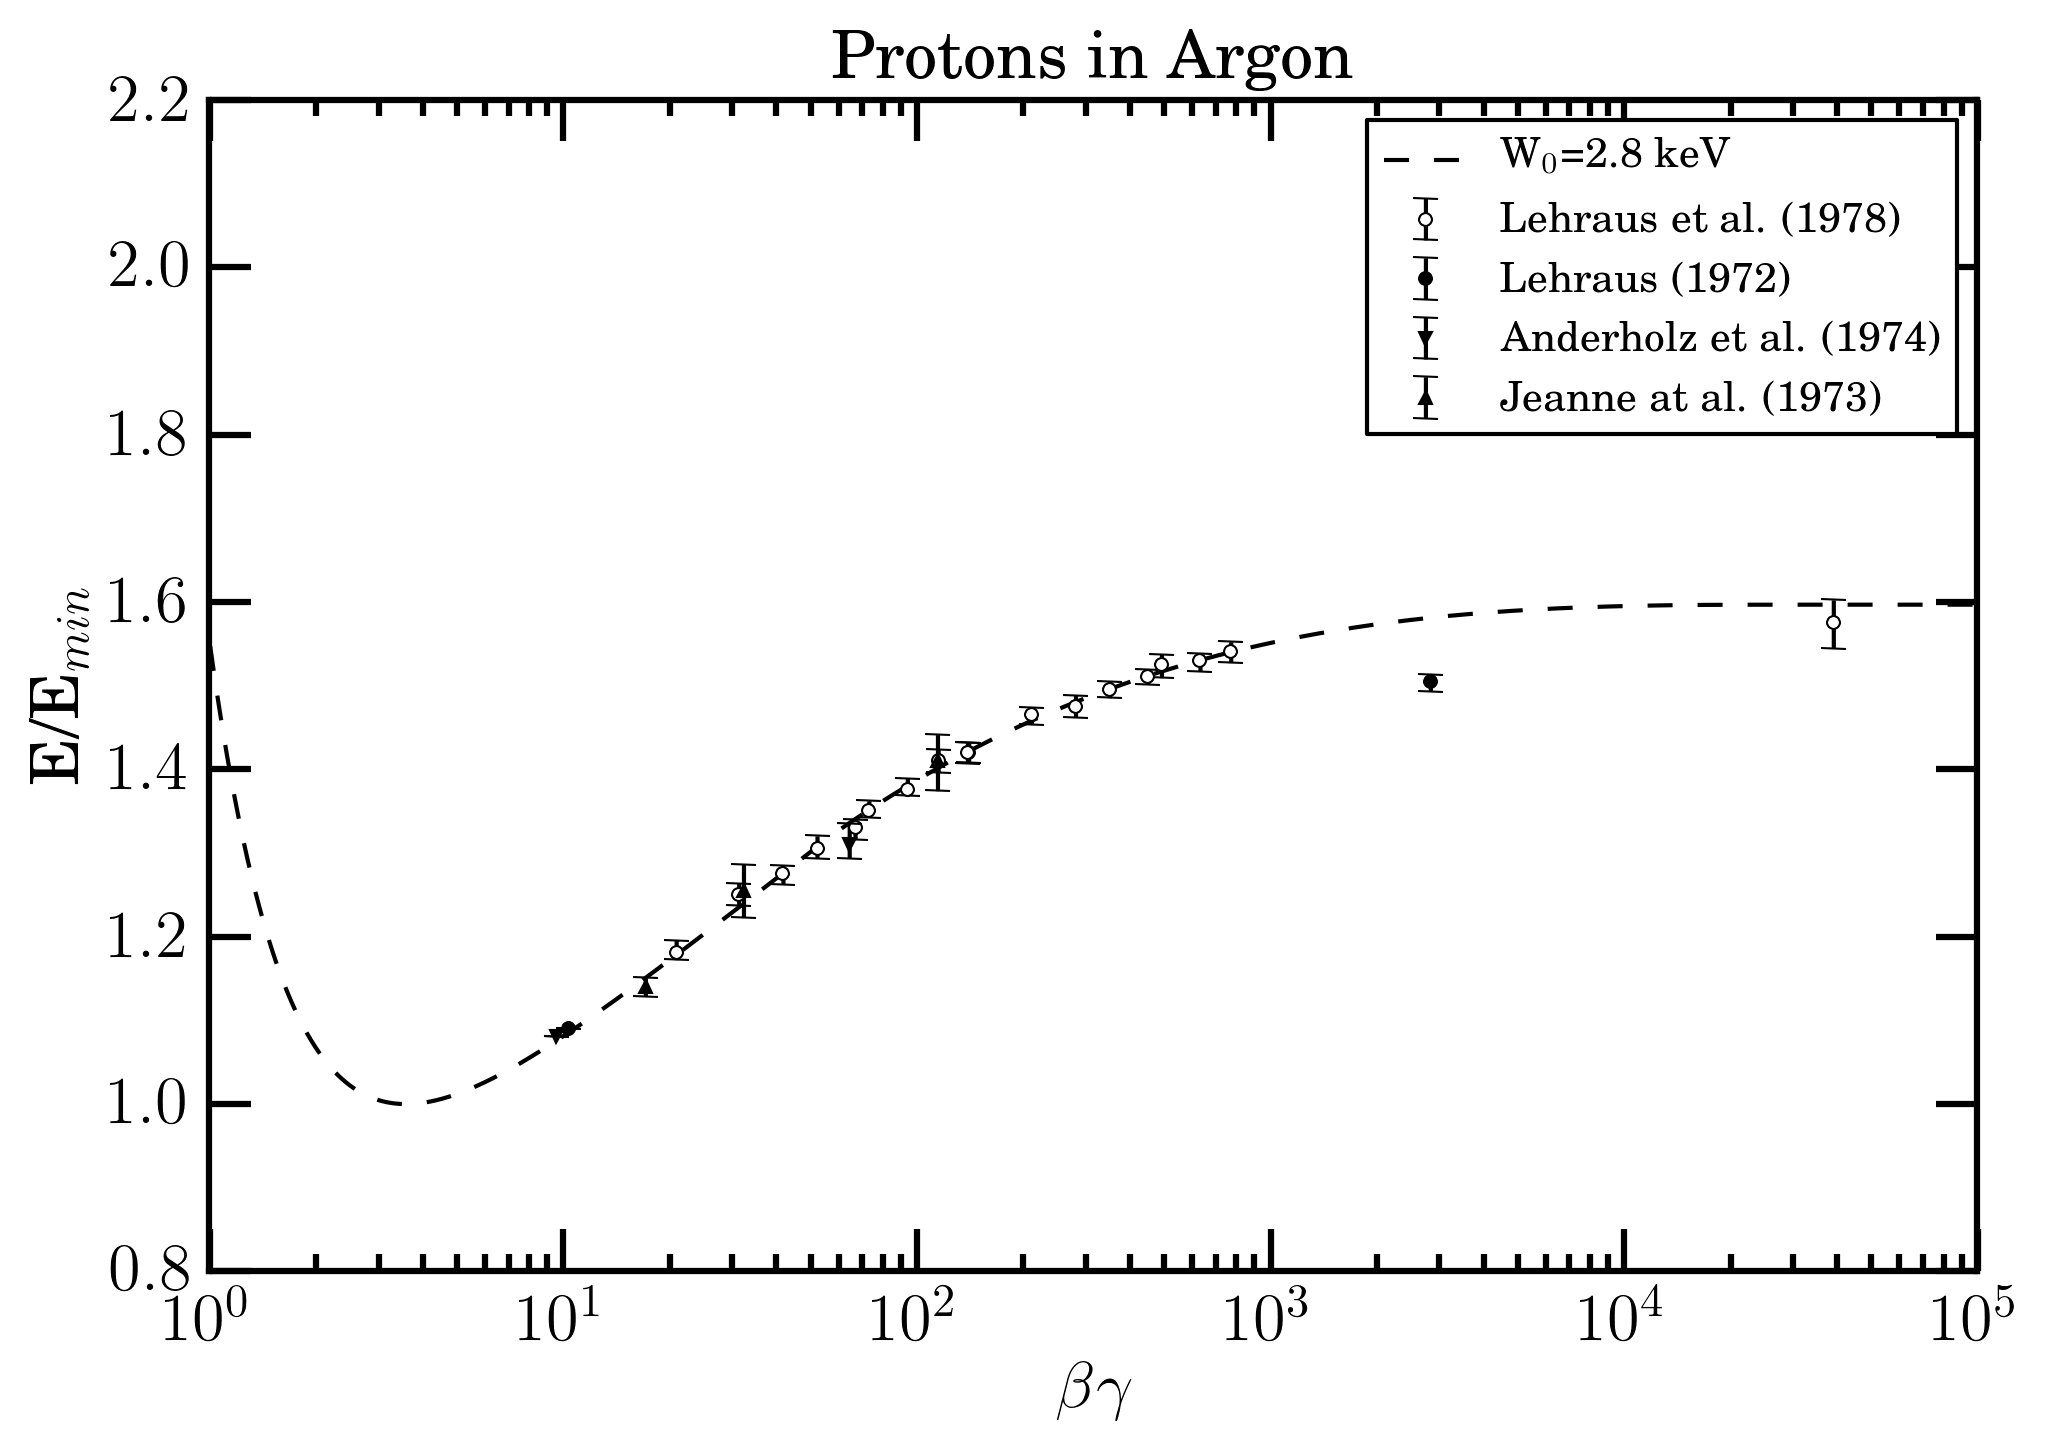 Figure A.
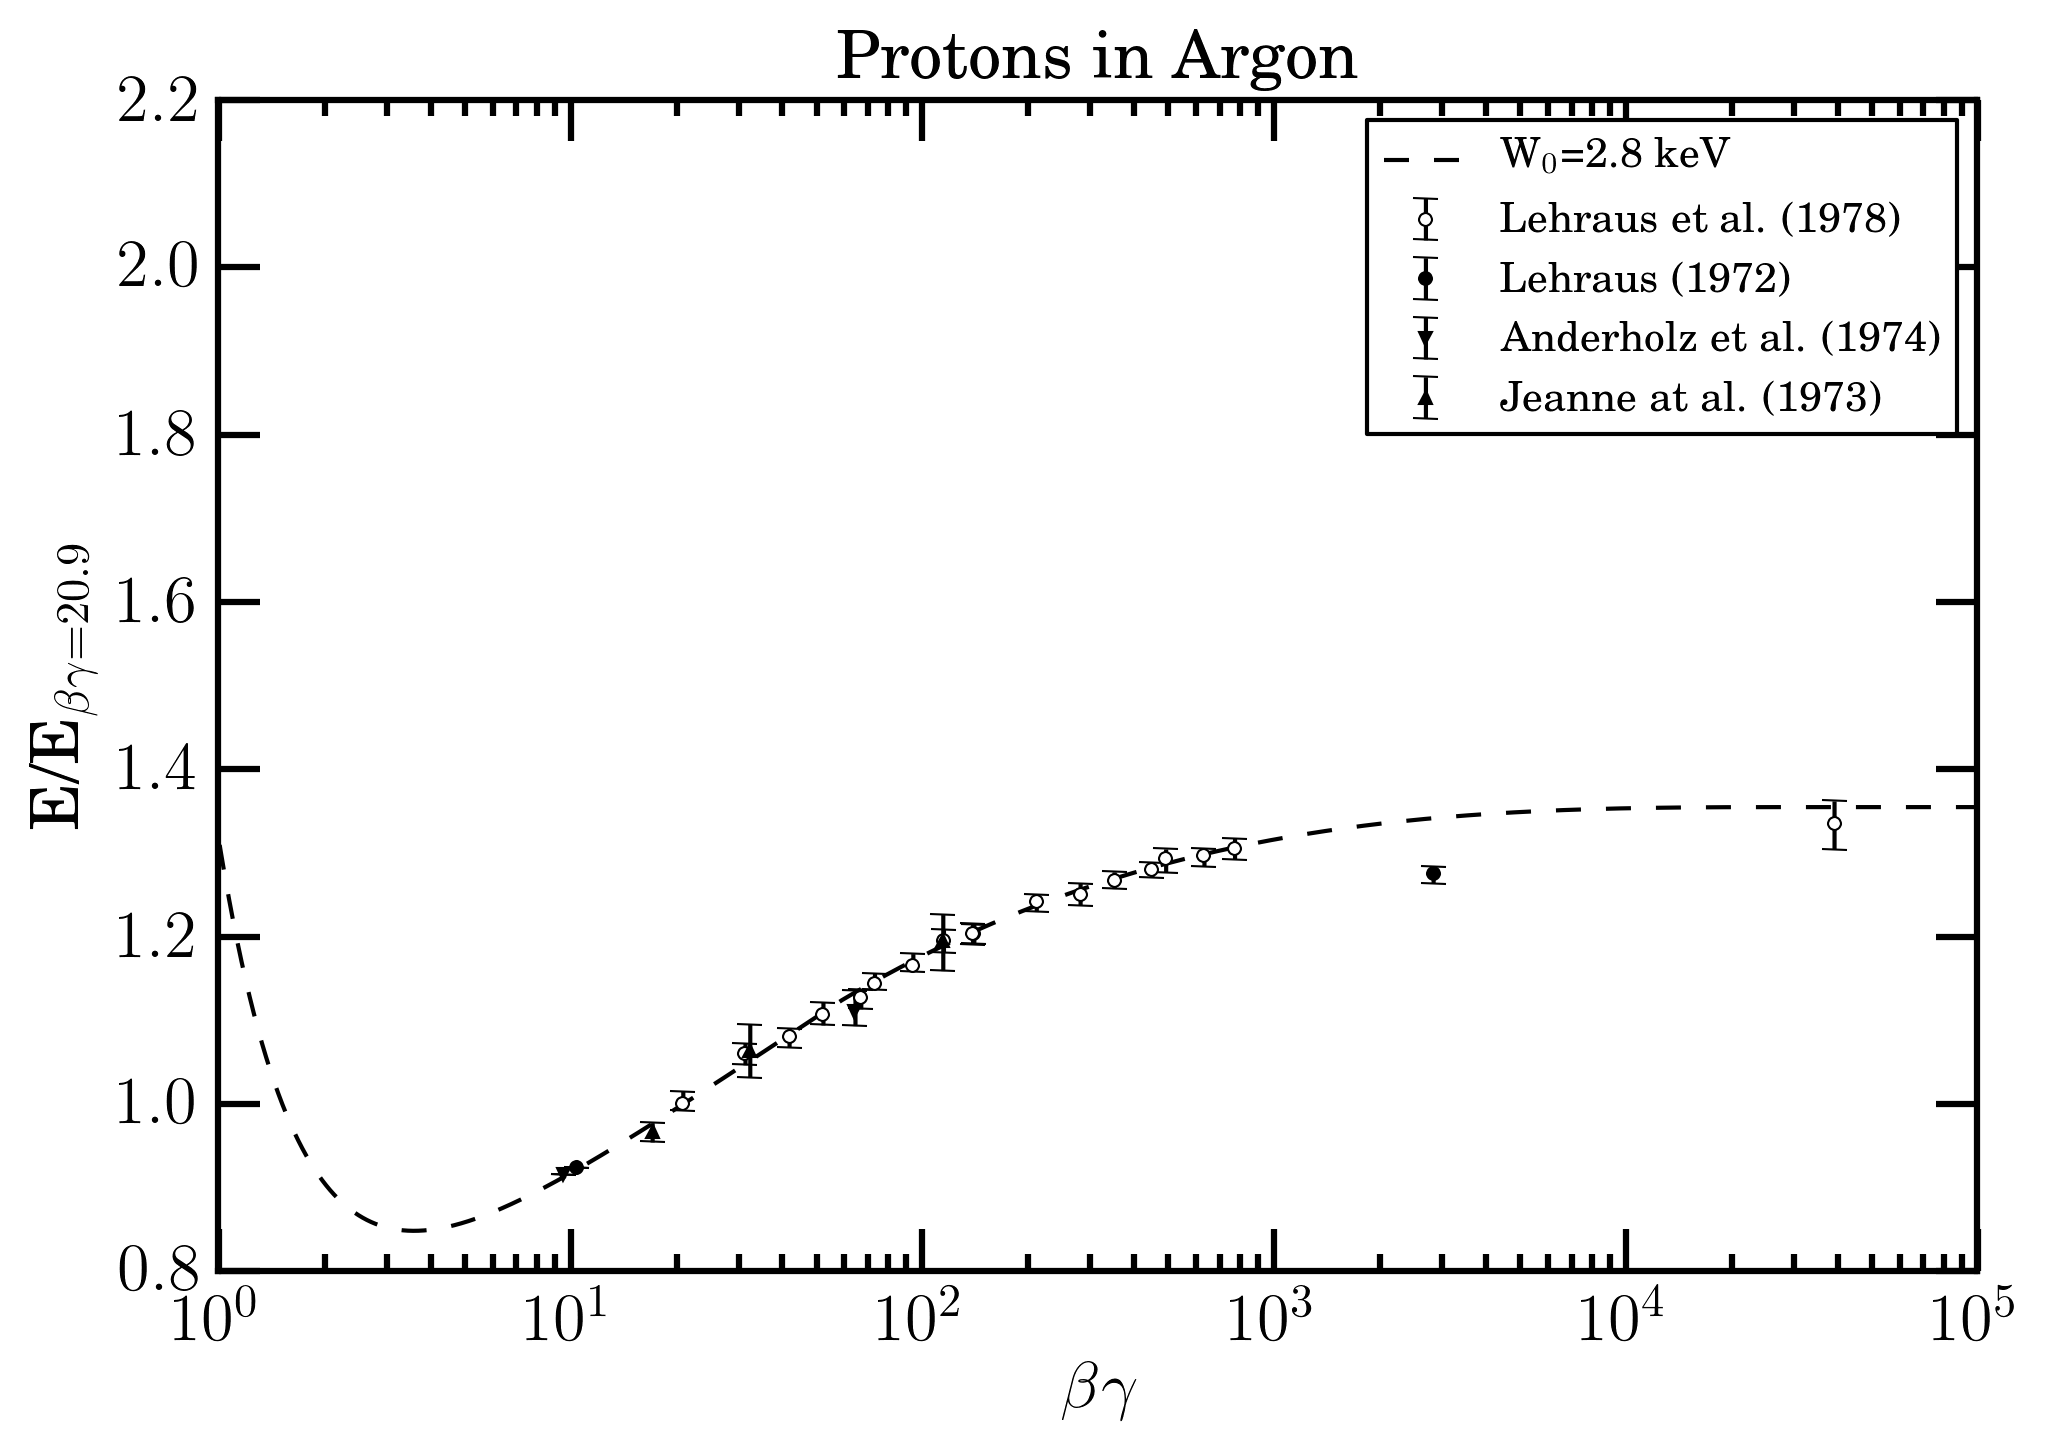
Figure B.
In Figures (A-B) the experimental data collected using a set of multi wire proportional chambers filled with Ar + 5% of CH3 at normal tempertature and pressure - and reported in TABLE 2 of Lehraus et al. (1978) - from Jeanne et al. (1973), Aderholtz et. al (1974), Lehraus (1972), Lerhaus et al (1978) are shown as a function of the βγ value of incoming massive particle. In Figure (A), data regard the ratios of the energy detected divided that corresponding to ionization minimum (e.g., see pages 349 and 354 of Leraus et al 1978); while in Figure (B), the ratios are those with respect to proton data at 19.6 GeV/c (i.e., beta gamma =20.9). In both Figures the dashed line is that obtained using the restricted energy-loss web calculator for Ar gas with W0 = 2.8 keV. The value of W0 found indicates that the energy detected using such a gaseous detector is mainly that deposited along the particle track. It is worth to remark how, also in emulsions, the value of W0 (= 6-10 keV) found by McNylty and Congel 1970 has indicated that the energy deposited accounted for was related to a finite volume about the particle trajectory (e.g. see page 2047 of McNylty and Congel 1970).
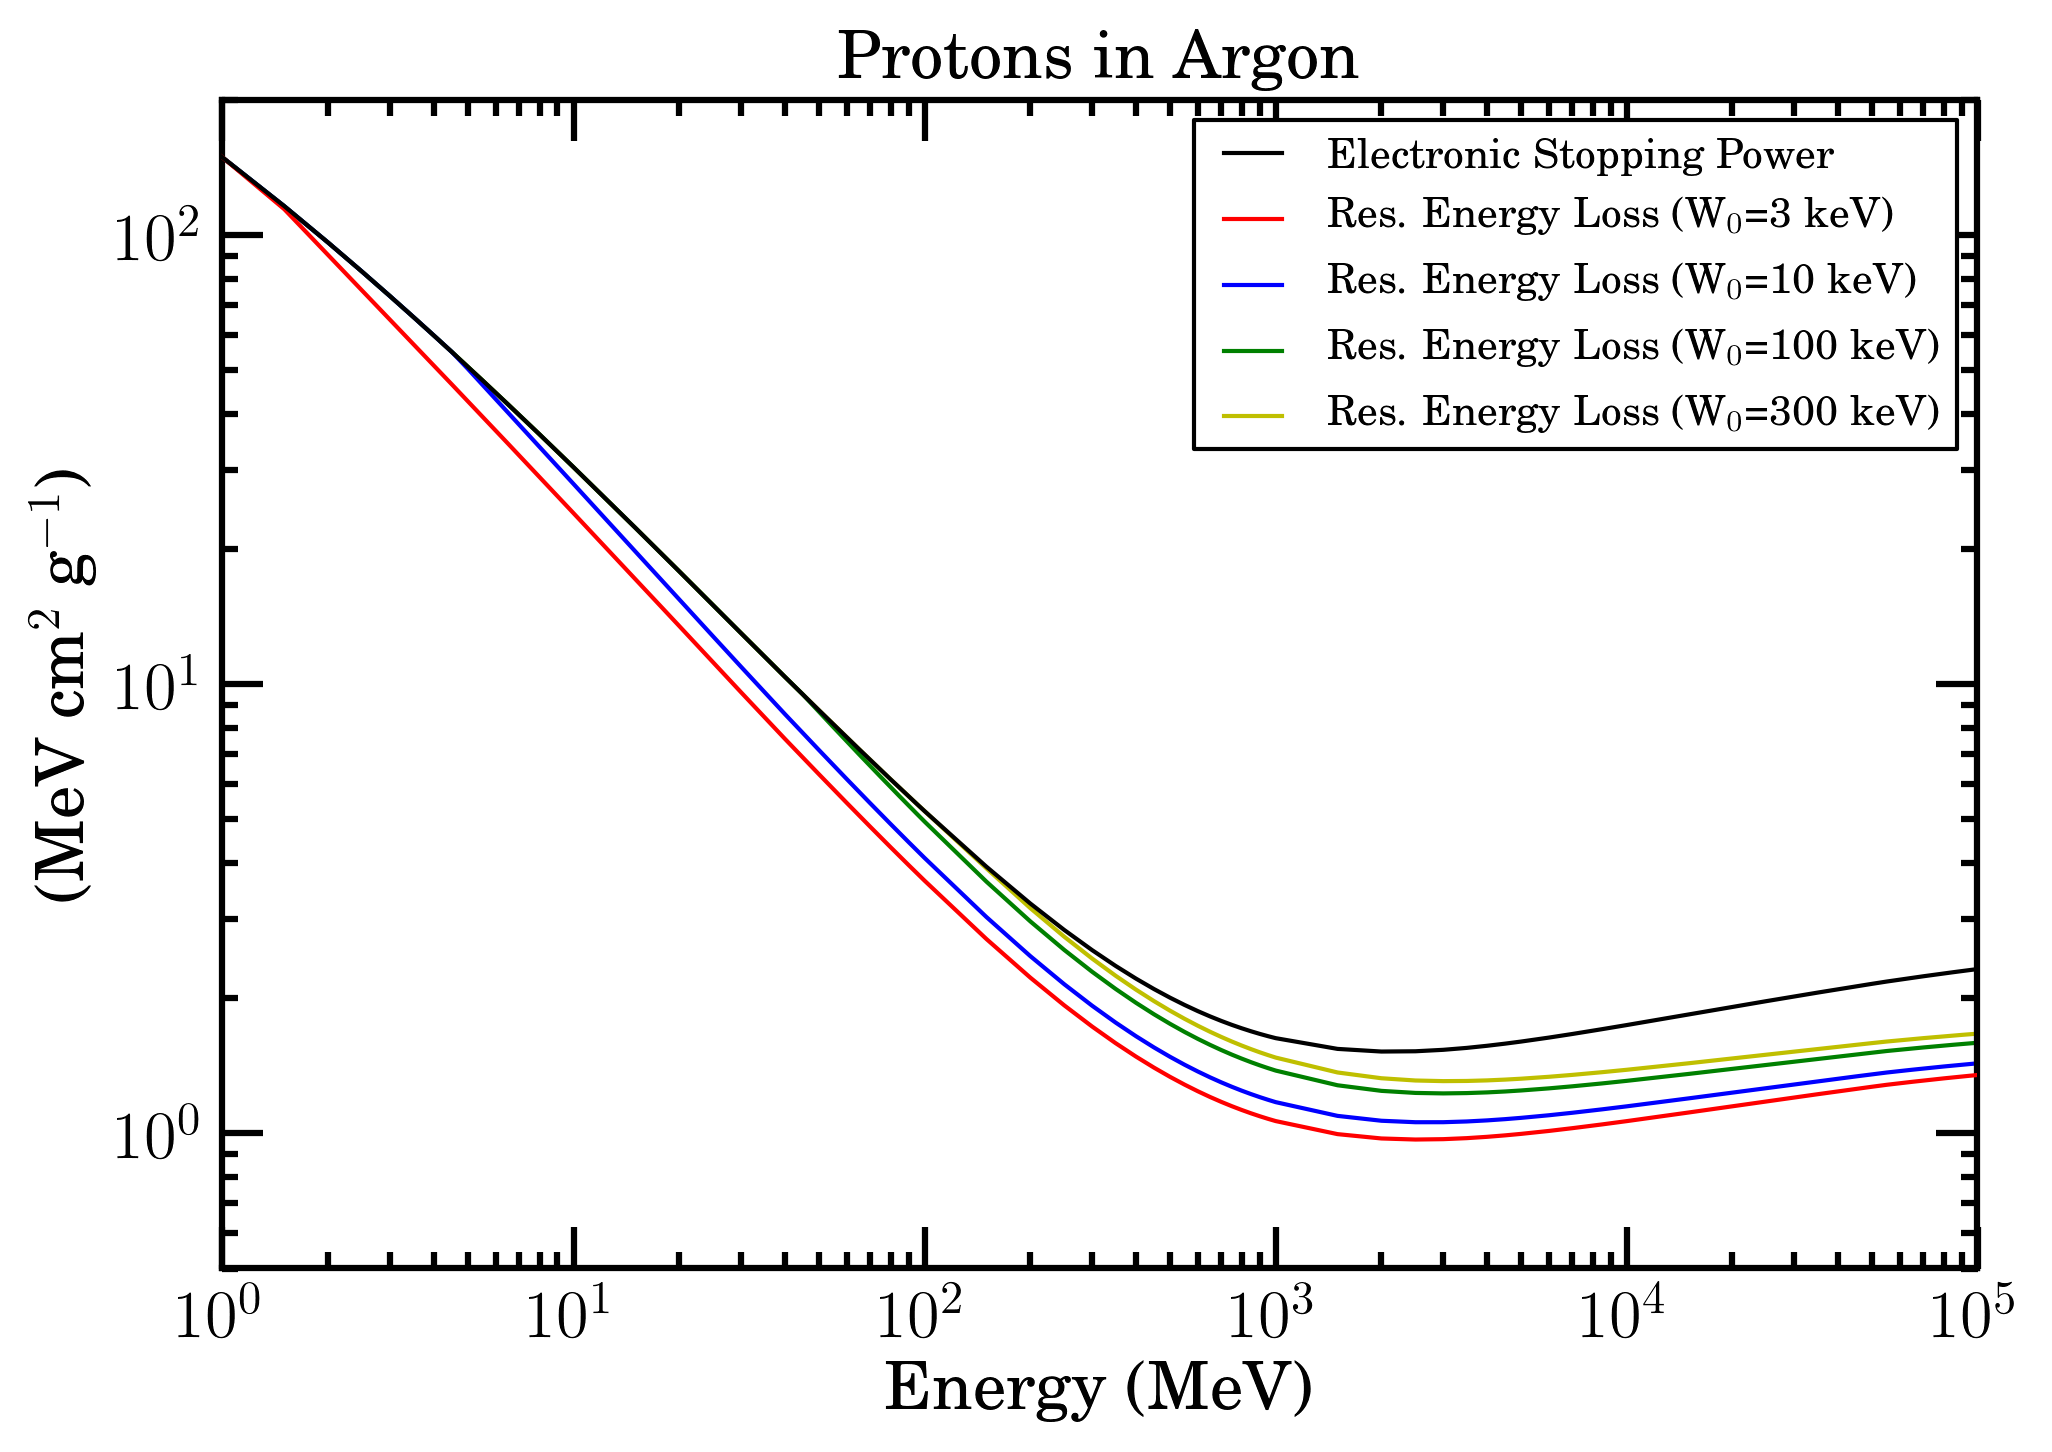 Electronic stopping power (black curve) and restricted energy loss with W0=3 keV (red curve), W0=10 keV (blue curve), W0=100 keV (green curve) and W0=300 keV (yellow curve) as a function of energy for protons in Argon in SR-Framework.
Bibliography
[Aderholtz et. al (1974)] M. Aderholtz, P. Lazeyras, I. Lehraus, R. Matthewson and W. Tejessy, Nucl. Instr. and Meth. 118 (1974) 419.
[Esbensen et al. (1978)] Esbensen, H. et al. (1978). Phys. Rev. B 18, 1039.
[Hancock, James, Movchet, Rancoita and Van Rossum (1983)] Hancock, S., James, F., Movchet, J., Rancoita, P.G. and Van Rossum, L. (1984). Nucl. Instr. and Meth. in Phys. Res. B 1, 16, doi: 10.1016/0168-583X(84)90472-5.
[Jeanne et al. (1973)] D. Jeanne, P. Lazeyras, I. Lehraus, R. Matthewson, W. Tejessy and M. Aderholtz, Nucl. Instr. and Meth. 111 (1973) 278.
[Lehraus (1972)] I. Lehraus, CERN/ECFA/72/4, Vol. 1 (July 1972) p. 60.
[Lehraus et al. (1978)] I. Lehraus, R. Matthewson and W. Tejessy, Performance of a large scale multilayer ionization detector and its use for measurements of the relativistic rise in the momentum range of 20–110 GeV/c, Nucl. Instr. and Meth. Volume 153, Issues 2–3, 15 July 1978, Pages 347-355
[Leroy and Rancoita (2016)] C. Leroy and P.G. Rancoita (2016), Principles of Radiation Interaction in Matter and Detection - 4th Edition -, World Scientific. Singapore, https://www.worldscientific.com/worldscibooks/10.1142/9167#t=aboutBook; it is also partially accessible via google books; ISBN-978-981-4603-18-8 (printed); ISBN.978-981-4603-19-5 (ebook).
[McNulty and Congel (1970)] P.J. McNulty and F.J. Congel, Restricted Energy Loss by Extremely Relativistic Particles, Phys. Rev. D 1, 3041 (1970)
[Rancoita (1984)] Rancoita, P.G. (1984). Silicon detectors and elementary particle physics, J. Phys. G: Nucl.Phys. 10, 299–319, doi: 10.1088/0305-4616/10/3/007.